
On May 12, the cryptocurrencies declined to their respective lows as bulls bought the dips. Nonetheless, for the past four days, the coins have been making an upward correction. On the upside, if the bulls break above the next resistance level, a rally to the previous highs is likely. Today, the upward corrections appear to face resistance. This is an indication of further selling pressure to the downside.
BTC/USD Major Trend: Bearish
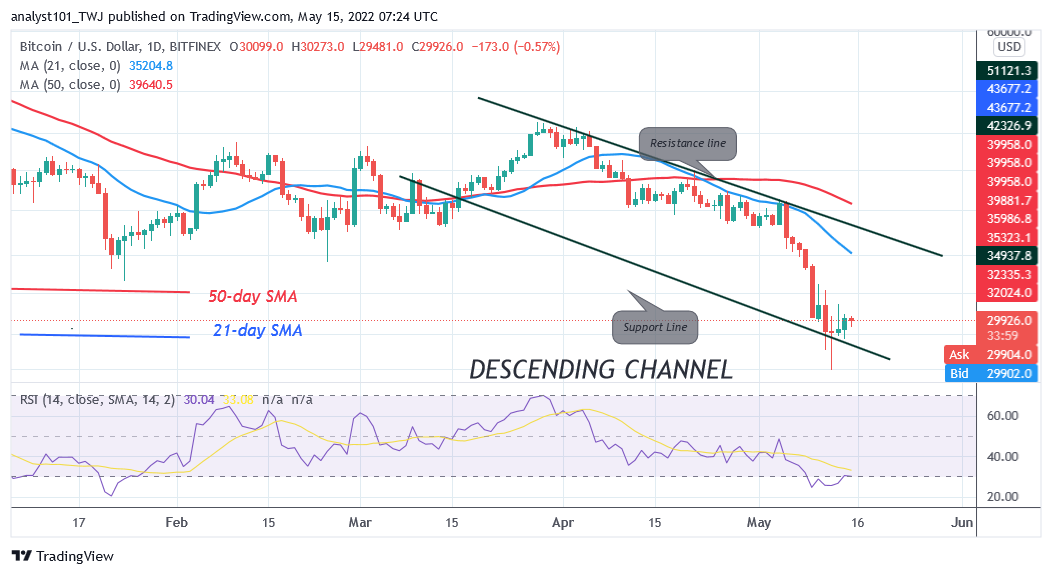
Bitcoin’s (BTC) price is in a downtrend as price plunged to the low of $26,591 on May 12. The bulls have bought the dips as Bitcoin makes an upward correction to the previous high. Bitcoin is trading at $30,376 at the time of writing. It will rally to the $40,000 psychological price level if buyers sustain Bitcoin above the $33,000 resistance zone.
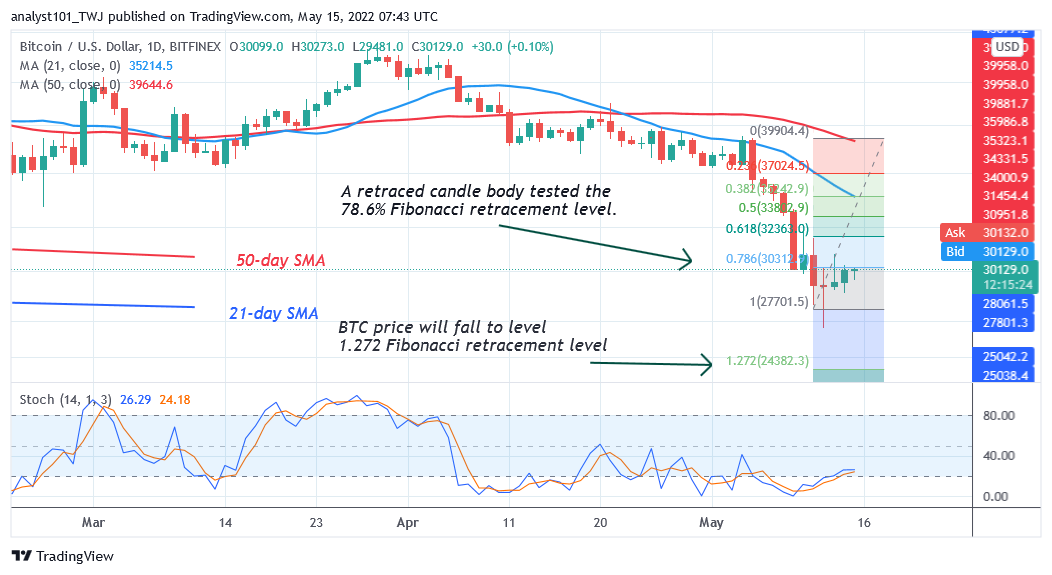
On the other hand, if the bulls fail to break above the $33,000 resistance, Bitcoin will be compelled to a range-bound move below the resistance zone. However, if the bears break below the $27,900 support, the market will decline to $25,000 low. Meanwhile, on May 11 downtrend; a retraced candle body tested the 78.6% Fibonacci retracement level. The retracement indicates that BTC will fall but reverse at level 1.272 Fibonacci extension or $24,382.30.
XRP/USD Major Trend: Bearish
Ripple’s (XRP) price is in a downtrend but the current downtrend has reached bearish exhaustion. On the weekly chart, XRP fell to the low of $0.54 price level on January 17. The cryptocurrency made an upward correction to the high of $0.78 on March 21.
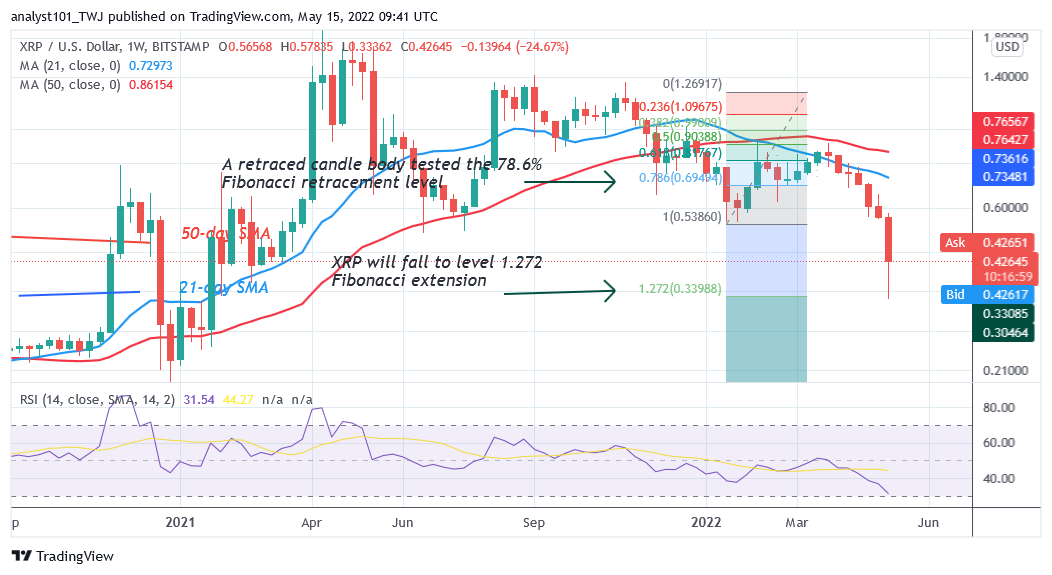
Since March 28, Ripple had been trading in the bear market as the altcoin plunged to the low of $0.33. Meanwhile, on the weekly chart; a retraced candle body tested the 78.6% Fibonacci retracement level on February 7. The retracement indicates that XRP will fall but reverse at level 1.272 Fibonacci extension or $0.33 price level. From the price action, XRP dropped sharply and retested the 1.272 Fibonacci extension but pulled back above the $0.42 support. The long candlestick’s tail pointing downward indicates that the current support has strong buying pressure.
DOT/USD Major Trend: Bearish
Polkadot’s (DOT) price is in a downtrend as the cryptocurrency fell to the low of $7.91. The bulls bought the dips as DOT price made an upward correction. The uptrend has been repelled as the altcoin resumes selling pressure.
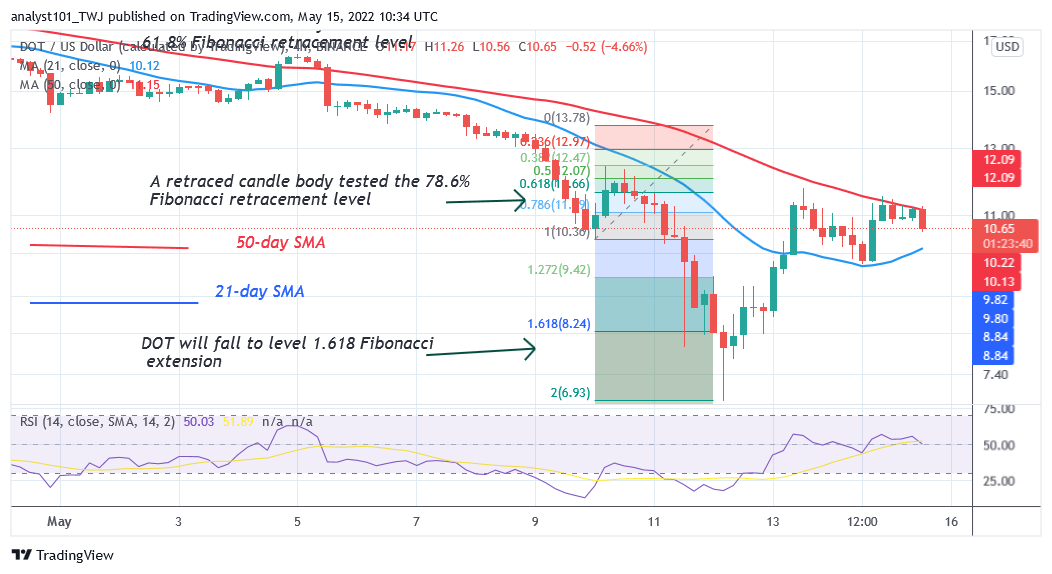
The bulls could not sustain the bullish momentum above the $12 resistance zone, hence the downward correction. On the upside, if the bulls have broken above the recent high, the market will rally to $15high. Nonetheless, Polkadot will fall and revisit the previous low. Meanwhile, on May 10 downtrend; a retraced candle body tested the 61.8% Fibonacci retracement level. The retracement indicates that DOT will fall to level 1.618 Fibonacci extension or $8.24. From the price action, the altcoin has retested the Fibonacci extension and resumed upward.
LTC /USD Major Trend: Bearish
Litecoin’s (LTC) price is in a downtrend as the cryptocurrency fell to the low of $54 on May 12. The bulls bought the dips as the altcoin resumed consolidation above the $64 support.
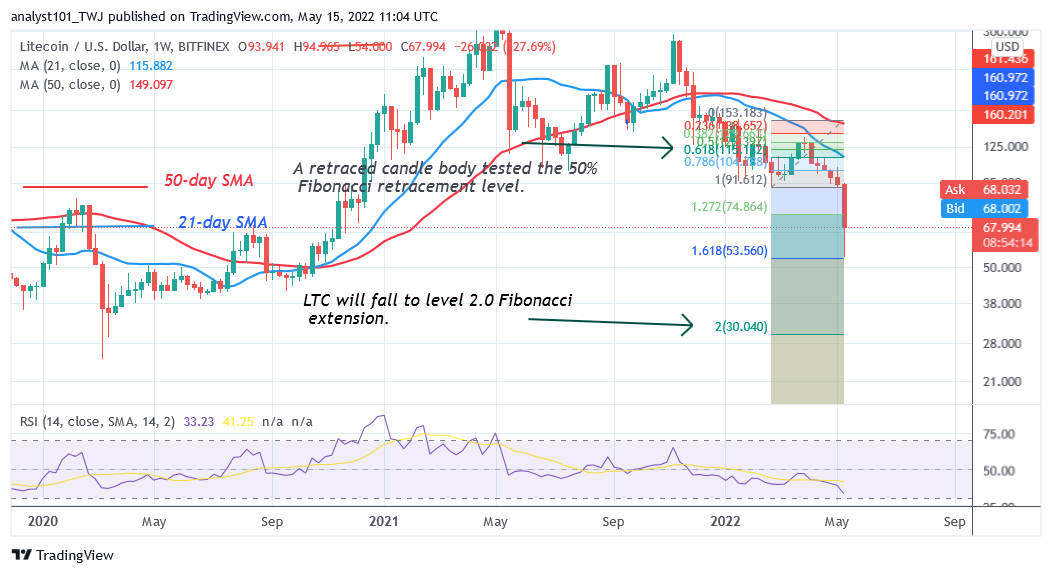
On the upside, if the bulls break above the $85 resistance, the upward move will resume to the previous highs. On the other hand, if the LTC price faces rejection at the recent high, the selling pressure may resume. Meanwhile, on a weekly chart; a retraced candle body tested the 50% Fibonacci retracement level on March 21. The retracement indicates that LTC will fall to level 2.0 Fibonacci extension or $30.04. From the price action, the downtrend will resume if price breaks below the $54 support.
LINK /USD Major Trend: Bearish
On May 12, Chainlink’s (LINK) price declined to $5.50 low as bulls bought the dips. For the past four days, the altcoin has been making upward corrections as it reaches the high of $7.46. The cryptocurrency is likely to face resistance at the recent high.
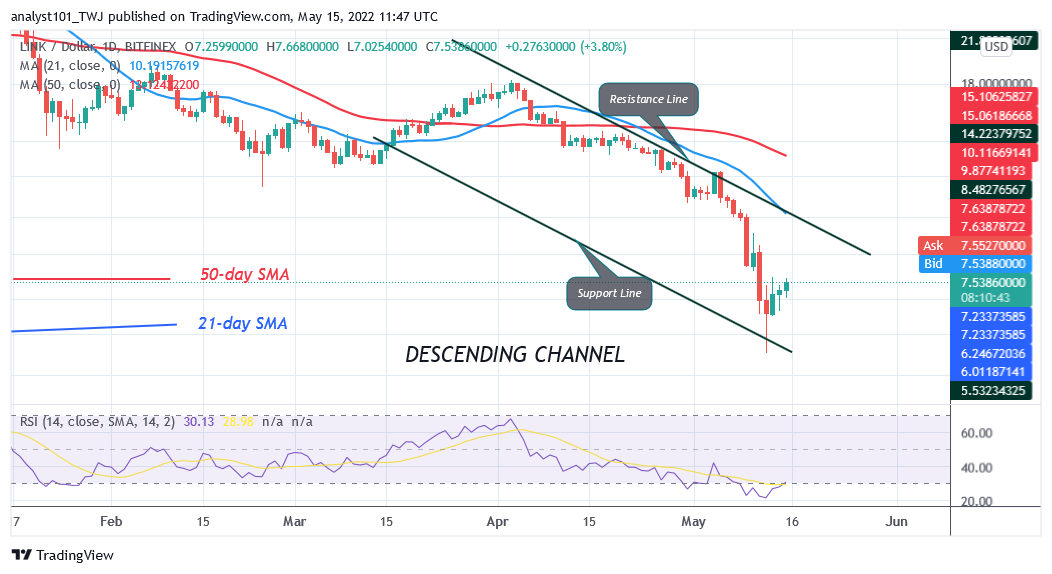
On the upside, if the bulls break above the $8 resistance, the altcoin will rally to the high of $12. However, if the current uptrend faces rejection at the recent high, the coin will decline and revisit the previous low at $5.50. Chainlink is at level 27 of the Relative Strength Index period 14. The crypto is trading in the oversold region of the market. The current selling pressure has reached bearish exhaustion as altcoin falls into the oversold region. Buyers are likely to emerge to push prices upward.


