BTC/USD faced rejections at the $58,000 and the $51,000 resistance levels as the king coin fell into a deeper correction. The altcoins under review are in a downward move. The coins are experiencing stiff rejection at the recent highs. The selling pressure may persist in the coming days.
BTC/USD Major Trend: Bearish
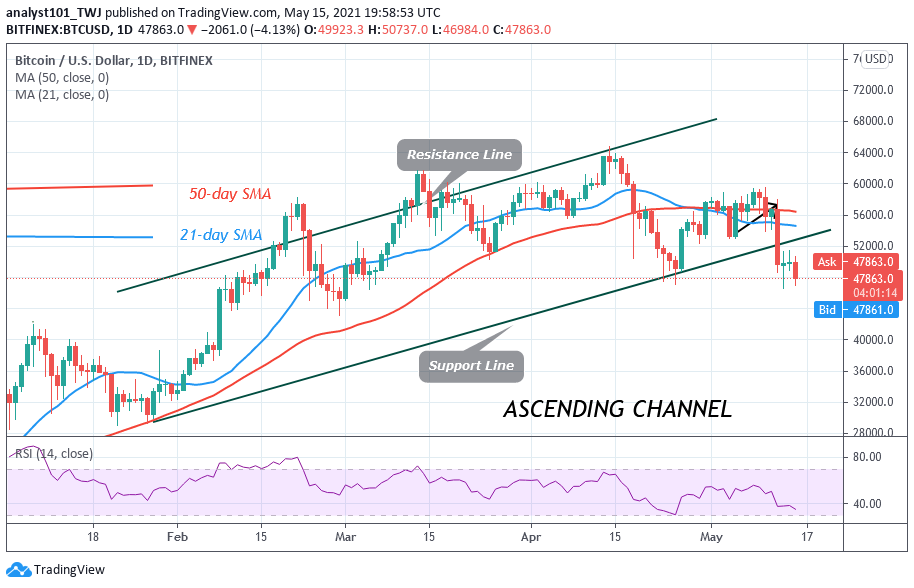
On May 12, Bitcoin faced resistance at the $58,000 high. This compelled the coin to plunge to $48,000 support. On May 14, the BTC price corrected upward and was repelled at the $51,000 resistance. BTC/USD is likely to fall into a deeper correction. On the upside, buyers have an uphill task to push Bitcoin on the upside. The bulls have to push the coin above the $58,000 support.
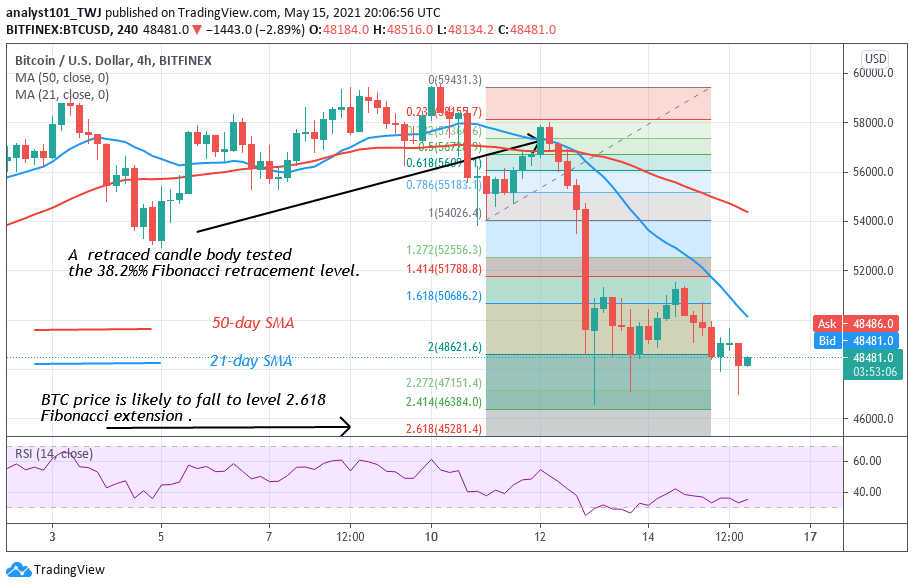
Meanwhile, BTC/USD is trading at $48,486.60 at the time of writing. The Fibonacci tool has indicated a further downward movement of prices. On May 11 downtrend; a retraced candle body tested the 38.2% Fibonacci retracement level. The retracement indicates that Bitcoin will fall to level 2.618 Fibonacci extension or a low of $45,281.60
DOT/USD Major Trend: Ranging
Today, Polkadot price is retracing after rejection from the high of $50. DOT price has earlier rallied to $50 after breaching the resistance levels of $40 and $42. On the downside, if price breaks below the $44 support, the altcoin will fall into the range-bound zone. A retest at the $50 resistance is possible if the current support holds.
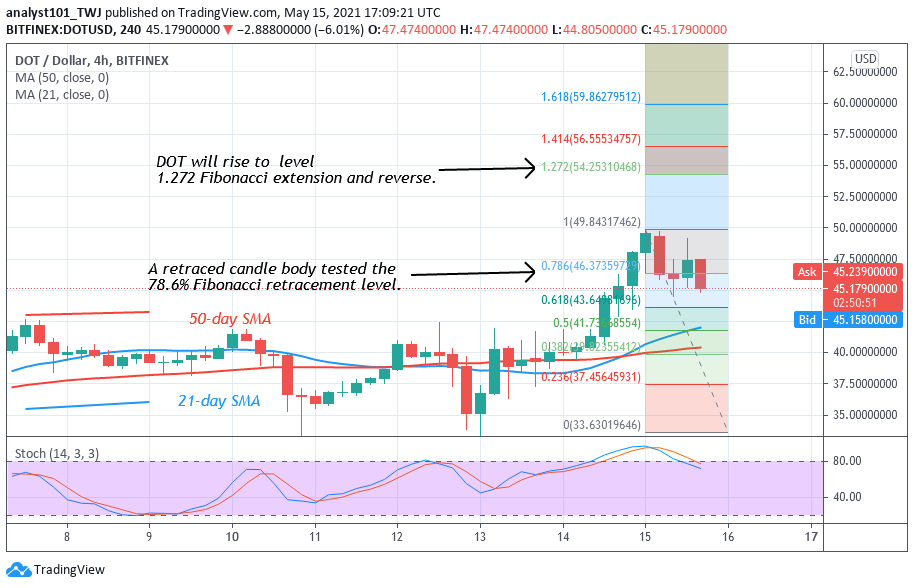
The uptrend will resume if the bulls overcome the resistance at $50. Otherwise, the DOT price will fall into the range-bound zone. Since February, DOT/USD has been fluctuating between $28 and $40. Meanwhile, on May 15 uptrend. a retraced candle body tested the 78.6% Fibonacci retracement level. The retracement gives the impression that the DOT price will rise to level 1.272 Fibonacci extension or the high of $54.25.
LTC /USD Major Trend: Bearish
On May 10, Litecoin faced rejection at the $420 overhead resistance. The altcoin has been in a downward move. LTC price is making a series of lower highs and lower lows. On May 14, buyers were rejected at the $340 resistance as the coin resumed another round of selling pressure.
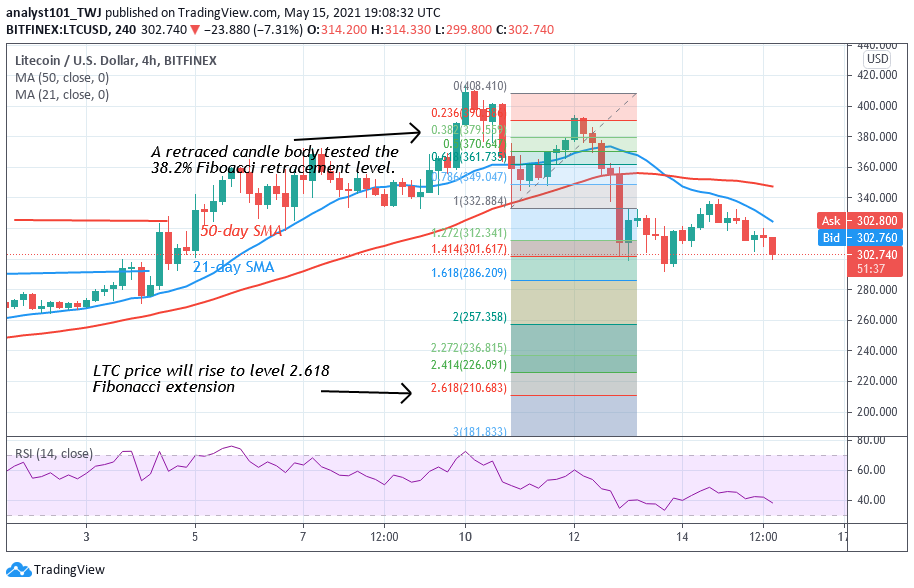
LTC price is falling and if it breaks below $300 support, the selling pressure will continue. The Fibonacci tool has indicated a downward movement of Litecoin. On May 10 uptrend a retraced candle body tested the 38.2% Fibonacci retracement level. The retracement indicates that Litecoin is likely to rise to level 2.618 Fibonacci extension or the low of $211.99.
LINK /USD Major Trend: Bullish
LINK/USD has fallen to the low of $43 from the high of $50. The altcoin is hovering above the $43 support. Incidentally, it is above the 21-day support. On the downside, if price breaks and closes below $43 support, the downtrend will extend to the low of $30. However, if price retraces and finds support above $43 or above 21-day SMA, the upside momentum will resume.
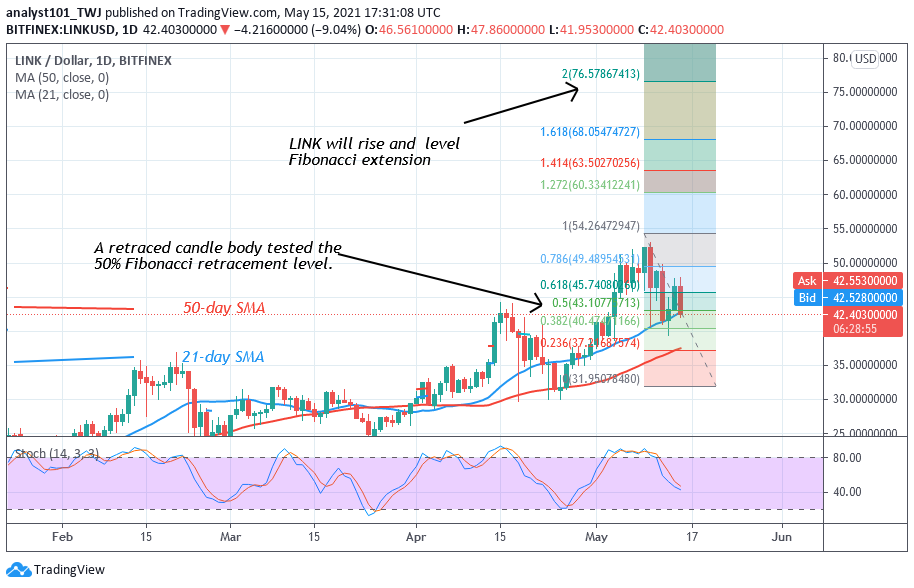
From the price action, the market is showing candlesticks with long tails above $40 support. This indicates that there is strong buying pressure above the $40 support. Nonetheless, the current retracement is likely to reach bearish exhaustion in the bullish trend zone. The Fibonacci tool has indicated an upward movement of prices. On May 9 uptrend; a retraced candle body tested the 50% Fibonacci retracement level. The retracement level indicates that the market will rise to level 2.0 Fibonacci extension or the high of $76.57.


