

Bitcoin price is now in a downward correction as price fluctuates between $30,000 and $42,500. The king coin is falling as it faces rejection at the high of $42,500. BTC price will resume upward move if price breaks above the recent high. Litecoin, Polkadot, and Chainlink are massively in a downward move. The three altcoins will further decline if their previous lows are broken.
BTC/USD Major Trend: Bearish
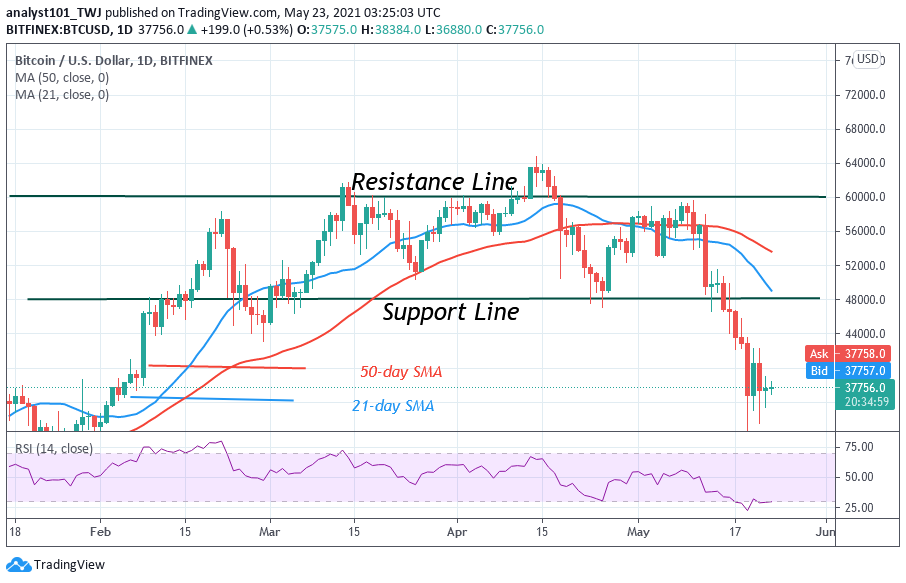
In a nutshell, Bitcoin is consolidating above the $30,000 support after falling to the low of $29,563. Presently, Bitcoin price action is characterized by small body candlesticks called Doji and Spinning tops. These candlesticks are describing that buyers and sellers are undecided about the direction of the market. For the past week, BTC/USD faced rejection at $51,000 which completed the bearish onslaught of Bitcoin. Meanwhile, from the Fibonacci tool, the major retracement candle body tested the 50% Fibonacci retracement level.
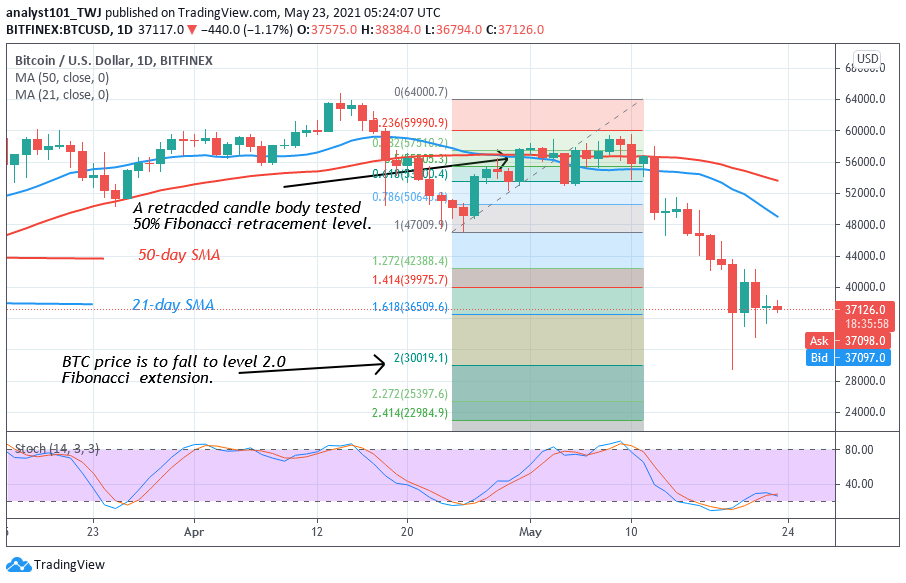
This retracement indicates the extent of price movement. This retracement implies that Bitcoin will fall to level 2.0 Fibonacci extension or a low of $29,800.60. From the price action, BTC price tested the 2.0 Fibonacci extension . For the past five days, the market has been consolidating above the $30,000 support. BTC price will resume upward if the current support holds.
DOT/USD Major Trend: Bearish
Polkadot (DOT) price has resumed a fresh downtrend. In the first breakdown, the altcoin plunged to $16 low. The bulls bought the dips as price corrected upward to $32 high. The bulls could not sustain the bullish momentum above $32 high. Consequently, the coin fell as selling pressure resumes. On the downside, Polkadot is likely to retrace to the previous low at $16.
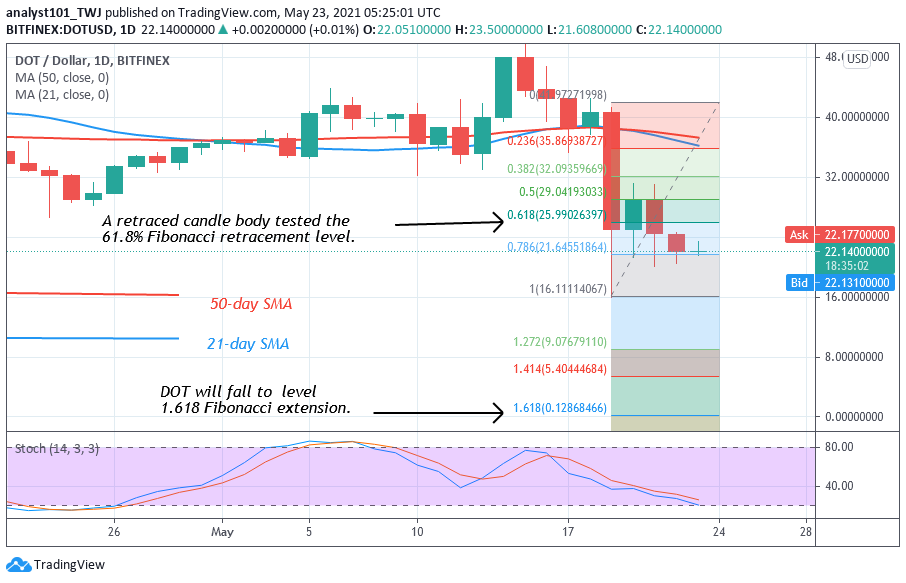
The altcoin will commence resumption of uptrend if the support at $16 holds. However, the DOT price will be weakened if the bears break the current support. Presently, DOT/USD is in a downward move to the previous low. Nonetheless, this week the price indicator has indicated a possible downward move of the coin. On May 19 downtrend; a retraced candle body tested the 61.8% Fibonacci retracement level. The retracement indicates that DOT will fall to level 1.618 Fibonacci extension. Nonetheless, further decline is possible if the current support is breached.
LTC /USD Major Trend: Bearish
Since May 10, Litecoin has been in a downward move. Today, LTC/USD has fallen to $160 low at the time of writing. On May 10, LTC slumped to $367 low, and price corrected upward to the $400 resistance zone. Buyers could not sustain the bullish momentum above the recent high. In the second breakdown, the altcoin fell to the low at $300.
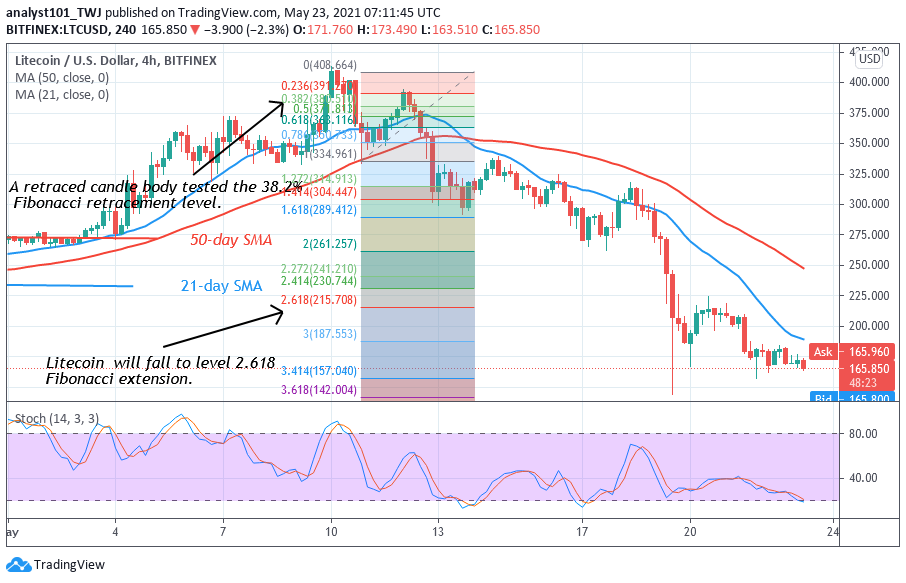
In the second breakdown, the bears broke below the moving averages, this signals the resumption of the downtrend. On May 19, Litecoin has already fallen to $144 low. The current bearish move is to revisit the previous low at $144. The Fibonacci tool has earlier indicated that Litecoin will fall to level 2.618 Fibonacci extension or the low of $215.70. The price action has surpassed the Fibonacci level as price reaches $155 low.
LINK /USD Major Trend: Bearish
On May 5, LINK/USD rallied to $51.18 high. Buyers could not sustain the bullish momentum above $50. The altcoin was compelled to a sideways move for five days before rebounding to reach the high of $52.50. The downtrend resumes as price makes a lower high of $52.50. On May 10, LINK price is making a series of lower highs and lower lows.
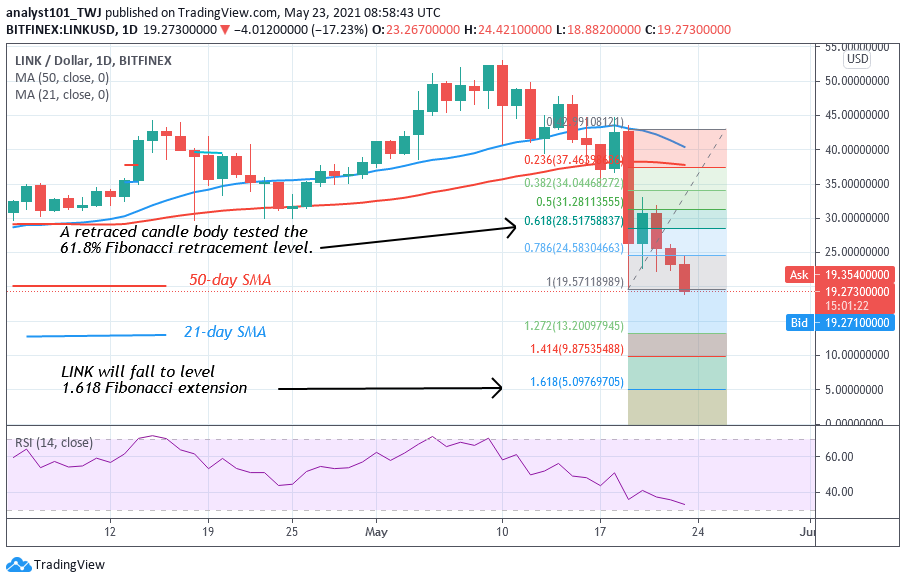
The selling pressure has continued as price reaches the low of $18 at the time of writing. The Fibonacci tool has indicated a downward movement of the coin. On May 19 downward, a retraced candle body tested the 61.8% Fibonacci retracement level. The retracement indicates that LINK price will decline to level 1.618 Fibonacci level or level $5.09.


