
Bitcoin and the altcoins have broken below the April 30 price level. The current price fall has put the cryptos in a prolonged oversold condition. There is a possibility of a price rebound as the cryptos resume consolidation above their respective price levels. Let us examine each of these cryptos.
BTC/USD Major Trend: Bearish
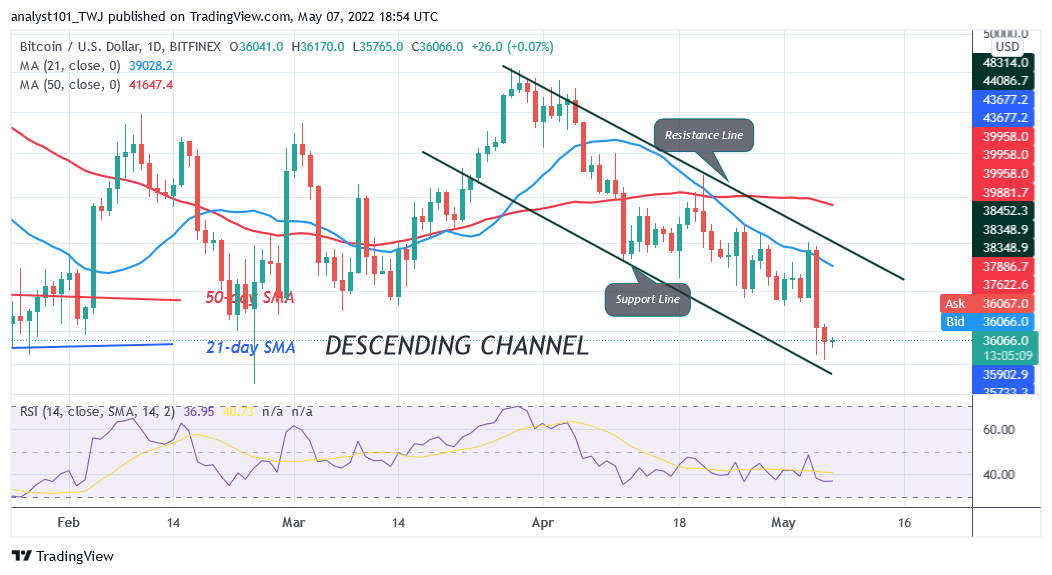
Bitcoin’s (BTC) price is in a downtrend as the crypto declined to the previous low of February 24. The largest cryptocurrency has fallen to the low of $34,279. Bitcoin is capable of revisiting the previous lows of $33,855 and $32937 price levels. In the previous price action on January 24, BTC’s price encountered a price rebound. BTC price dropped sharply to the low of $32,937 and rebounded. It rallied to the high of $39,416 but pulled to retest the $36,633 low. Later, the BTC price catapulted to the high of $45,899.
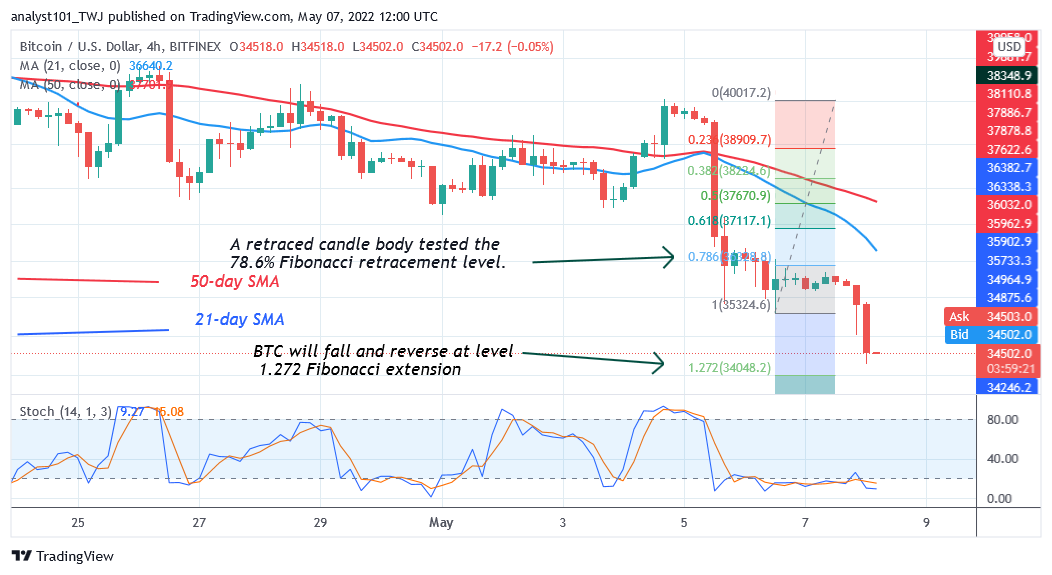
Today, the market is still in a downward move as it approaches the low of $33,855 price level. Meanwhile, on May 6 downtrend; a retraced candle body tested the 78.6% Fibonacci retracement level. The retracement indicates that BTC will fall but reverse at level 1.272 Fibonacci extension or $34,048.20 price level. In the meantime, Bitcoin is below the 20% range of the daily stochastic. It indicates that the market has reached an oversold region of the market.
XRP/USD Major Trend: Bearish
Ripple’s (XRP) price is in a downtrend as the cryptocurrency fell to the low of $0.56 on April 30. For the past week, buyers have been defending the current support. On May 4, XRP rose to the high of $0.65 but was repelled.
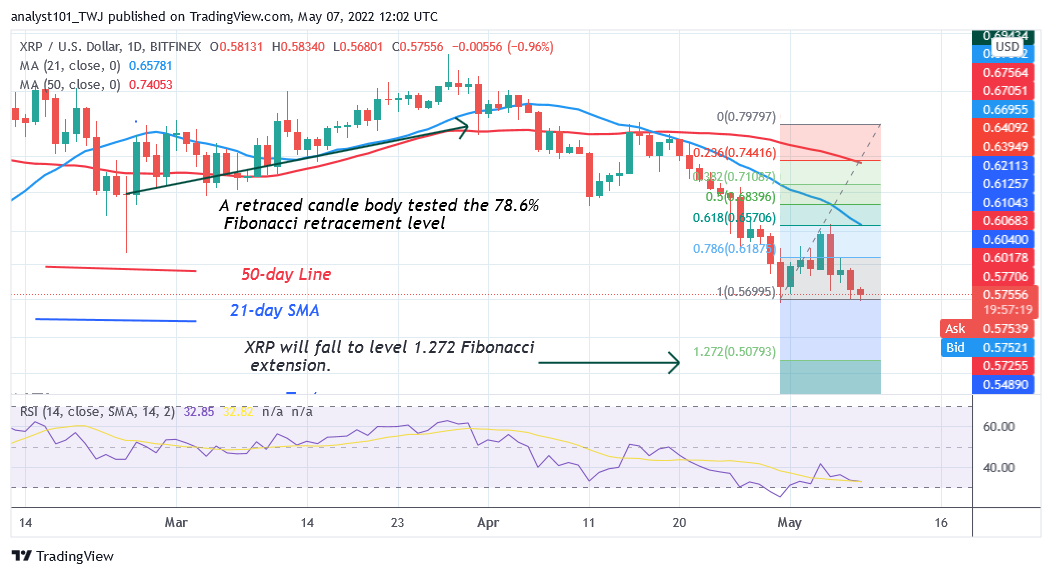
The bullish momentum could not be sustained as the altcoin fell to the current support. On the downside, if the bears broke below the current support, the selling pressure will resume. XRP will further decline to the previous low at $0.54. Meanwhile, on April 30 downtrend; a retraced candle body tested the 78.6% Fibonacci retracement level. The retracement indicates that XRP will fall but reverse at level 1.272 Fibonacci extension or $0.50 price level.
DOT/USD Major Trend: Bearish
Polkadot’s (DOT) price is in a downtrend and the cryptocurrency has fallen to the low of $13.27. DOT price has fallen significantly as it broke below the previous low of $14.18.
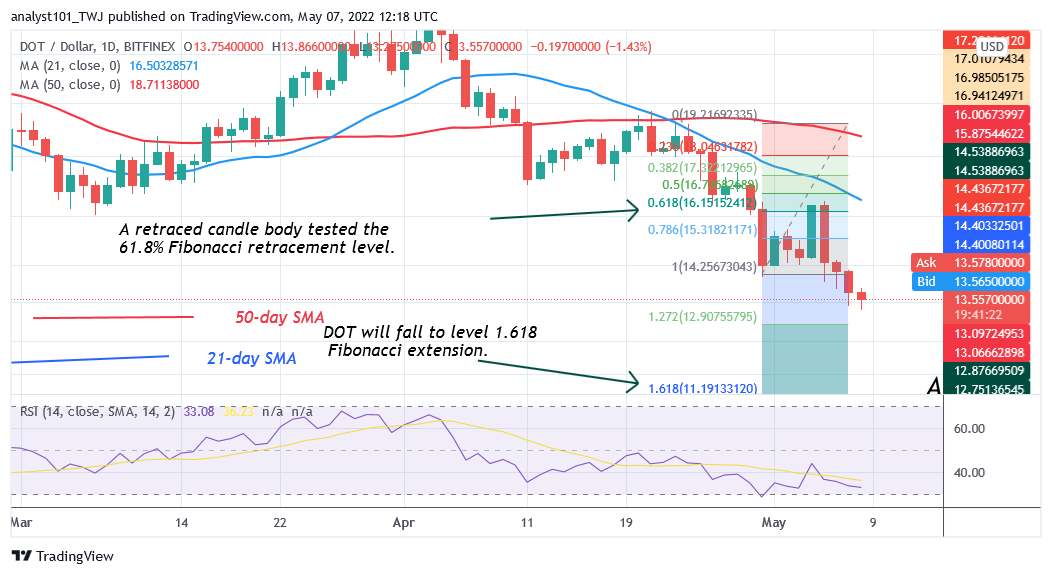
The bears broke the current support because buyers failed to keep DOT price above the $17 resistance. The altcoin rallied to the high of $16.34 and was repelled. On the downside, Polkadot is expected to decline to the downside. Meanwhile, on April 30 downtrend; a retraced candle body tested the 61.8% Fibonacci retracement level. The retracement indicates that DOT will fall to level 1.618 Fibonacci extension or $11.19. From the price action, the altcoin has fallen to the low of $13.27.
LTC /USD Major Trend: Bearish
Litecoin’s (LTC) price is in a downtrend but buyers are still defending the April 30 support at $94. For the past week, buyers have made concerted efforts to break above the moving averages. On May 4, Litecoin was in a bullish momentum as it reached the high of $107 but was repelled.
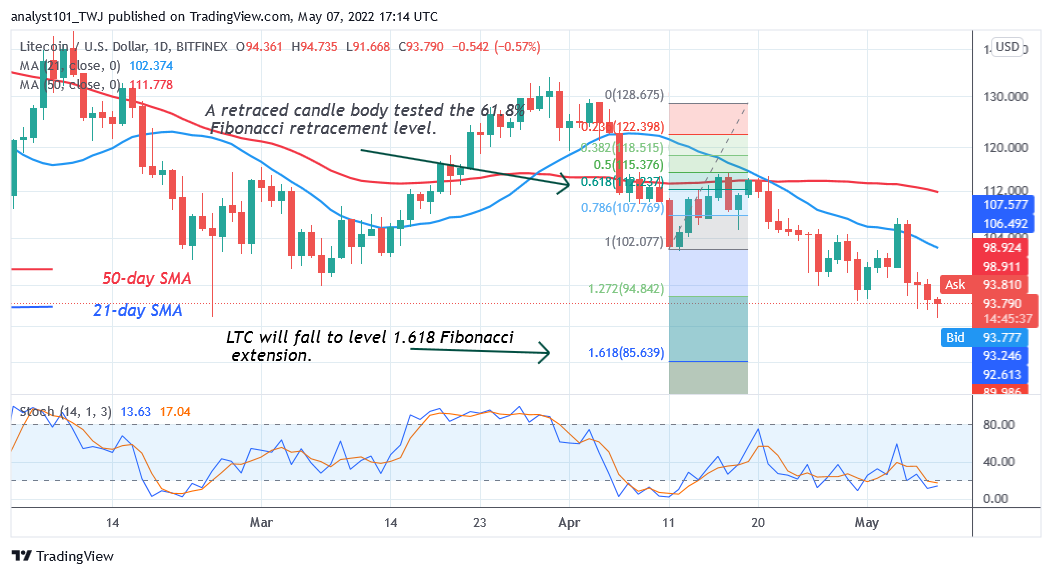
The bulls could not break the resistance at $110 and the 21-day line moving average. The bears have pushed the LTC price to the current support at $94 as they attempt to break below it. Nonetheless, the bears have not broken below the current support since January. The only attempt made was on February 24 when the altcoin dropped sharply to the low of $91 and pulled back. Today, the market has declined to the low of $91.66. Meanwhile, on April 11 downtrend; a retraced candle body tested the 61.8% Fibonacci retracement level. The retracement indicates that LTC will fall to level 1.618 Fibonacci extension or $85.83. From the price action, the altcoin is approaching level 1.618 Fibonacci extension.
LINK /USD Major Trend: Bearish
Chainlink’s (LINK) price is in a downtrend as the altcoin continues the downward move. The April 30 support has been broken as the crypto fell to the low of $9.91. The crypto has fallen below the February 24 previous low of $11.43. The altcoin is trading below the 20% range of the daily stochastic.
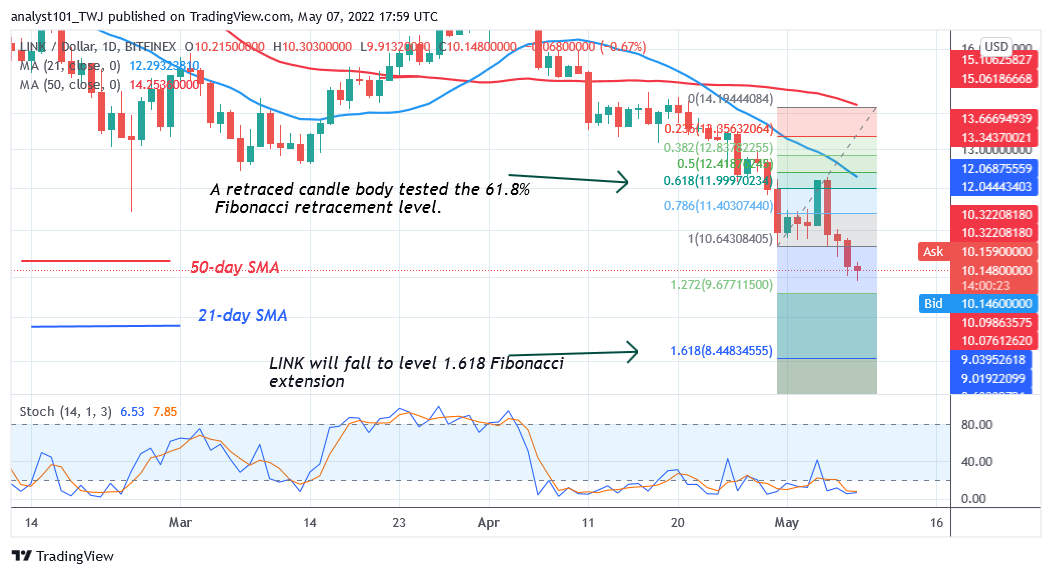
It implies that further downward movement of price is unlikely as the altcoin reaches the oversold region. Meanwhile, on April 30 downtrend; a retraced candle body tested the 61.8% Fibonacci retracement level. The retracement indicates that LINK will fall to level 1.618 Fibonacci extension or $8.44. From the price action, the altcoin has fallen to the low of $10.02 as bulls bought the dips.


