

Bitcoin bulls have broken the crucial resistance at $58,000 for the first time since May 1. This has propelled Bitcoin to resume upside momentum. However, it is doubtful if the bullish momentum will extend above the $60,000 high as the market approaches the overbought region.
Chainlink and Litecoin have broken their current resistance levels as the altcoins resume up trending. Polkadot has remained range-bound below $40 overhead resistance since February.
BTC/USD Major Trend: Bullish
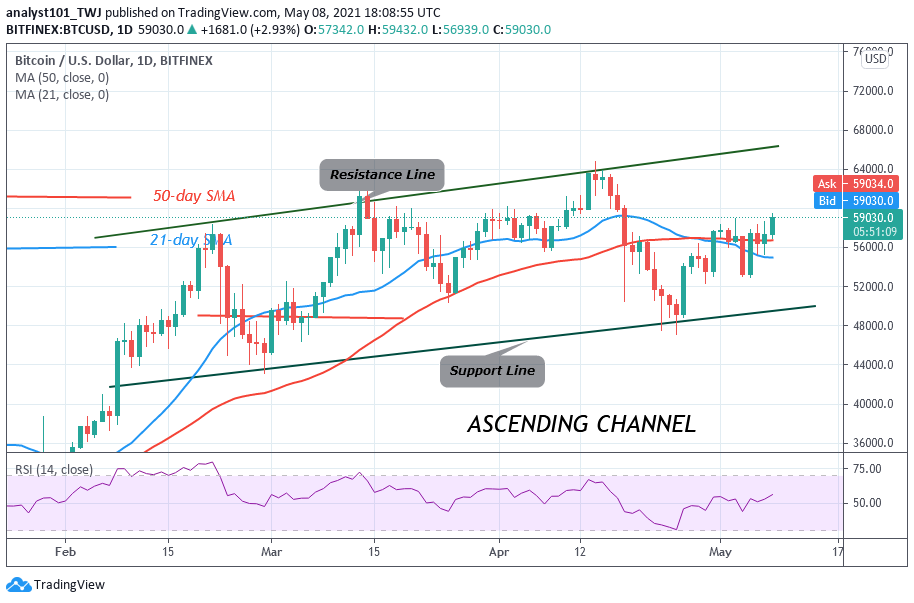
BTC/USD have made an impressive move after overcoming the $58,000 resistance. This will be the first time buyers are breaking the $58,000 resistance convincingly since May 1. For the past week, the king coin has been fluctuating between $53,000 and $57,000 price levels. If the current bullish momentum is sustained, a rally to $60,000 high is expected. Nevertheless, if buyers breach the $60,000 high, the rally will extend to the high of $65,000. However, it is doubtful if the rally will extend to the $65,000 high as the market approaches the overbought region.
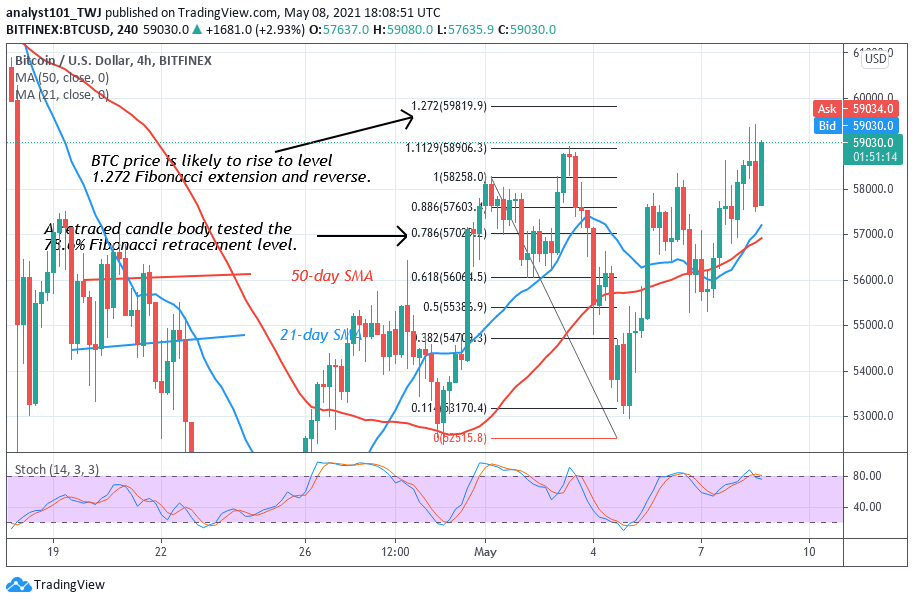
Nonetheless, the Fibonacci tool has indicated a marginal upward move of the coin. On May 1 uptrend; a retraced candle body tested the 78.6% Fibonacci retracement level. The retracement indicates that Bitcoin will rise to level 1.272 Fibonacci extension or a high of $59,819.90. Later, Bitcoin will reverse and return to 78.6% Fibonacci retracement level where it originated
DOT/USD Major Trend: Ranging
Polkadot is in a sideways trend below the $40 overhead resistance. Today, DOT price has declined below the overhead resistance after breaking above it. The altcoin is yet to trend upward because of selling pressure above the overhead resistance.
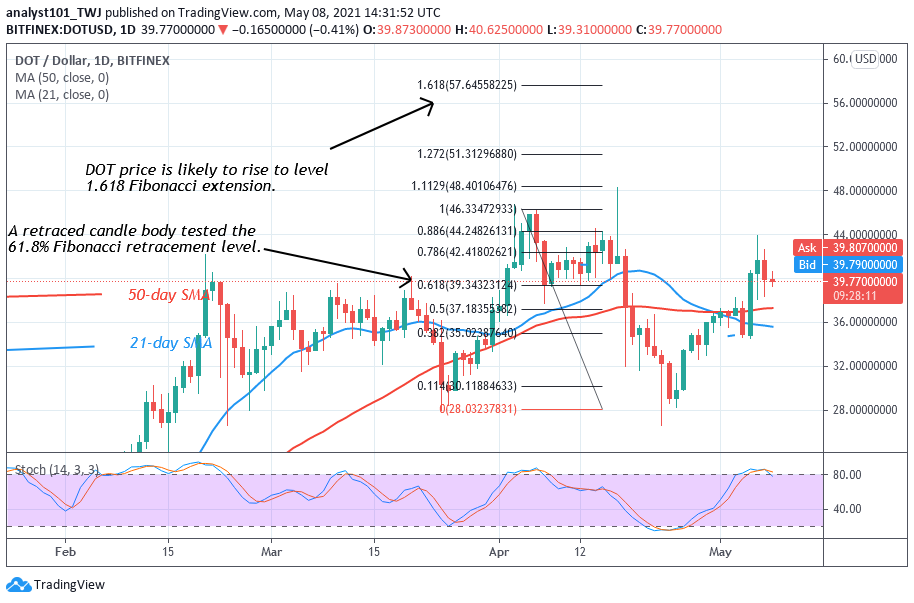
For the past week, the altcoin has been in an upward move to retest the $40 overhead resistance. In the previous price action on April 17, DOT price plunged to $28 low after rejection from the overhead resistance. The Fibonacci tool has indicated a possible upward movement of prices. On April 4 uptrend, a retraced candle body tested the 61.8% Fibonacci retracement level. The retracement gives the impression that DOT price will rise to level 1.618 Fibonacci extension or the high of $57.64
LTC /USD Major Trend: Bullish
Litecoin is retracing on the downside after reaching the high of $370. For the past week, the altcoin has been in an upward move after it fell to the low of $211. As bulls bought the dips, Litecoin resumed a fresh uptrend.
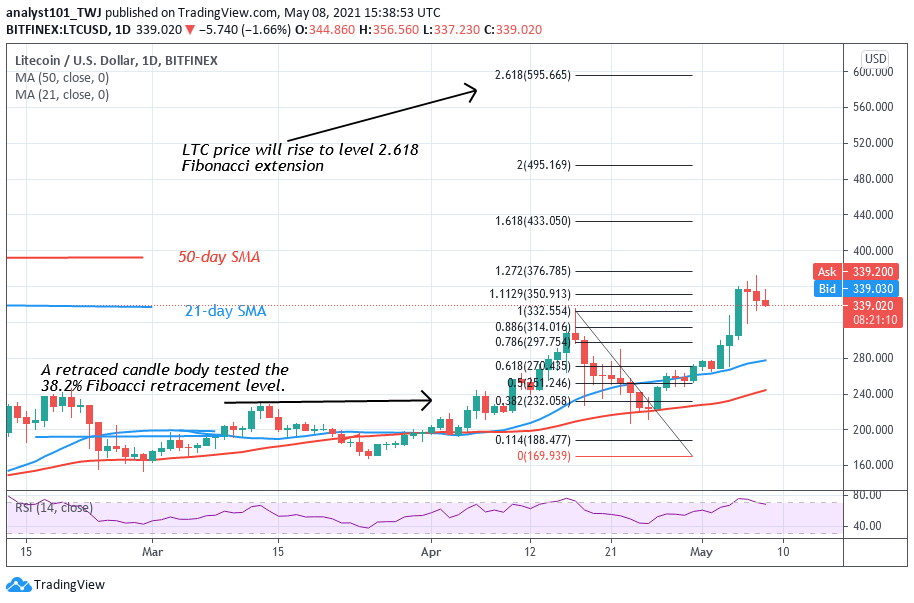
LTC price rallied and broke the resistance at $335 to reach a new high of $370. Presently, Litecoin is facing rejection at the recent high. LTC /USD is in a downward move. The uptrend will resume if price retraces and find support above the $320 support. However, the selling pressure will continue if price falls below $320. As long as the crypto’s price is above the moving averages, the uptrend will continue. On April 17 uptrend a retraced candle body tested the 38.2% Fibonacci retracement level. The retracement indicates that Litecoin is likely to rise to level 2.618 Fibonacci extension or the high of $595.65.
LINK /USD Major Trend: Bullish
On May 4, the bulls broke the resistance at $44 as Chainlink rallied to $52 high. LINK price could not rally above the resistance level because of the presence of sellers. Presently, the altcoin is consolidating above $47 near the resistance zone. Nonetheless, for the past three days, the altcoin has been fluctuating between $46 and $52.
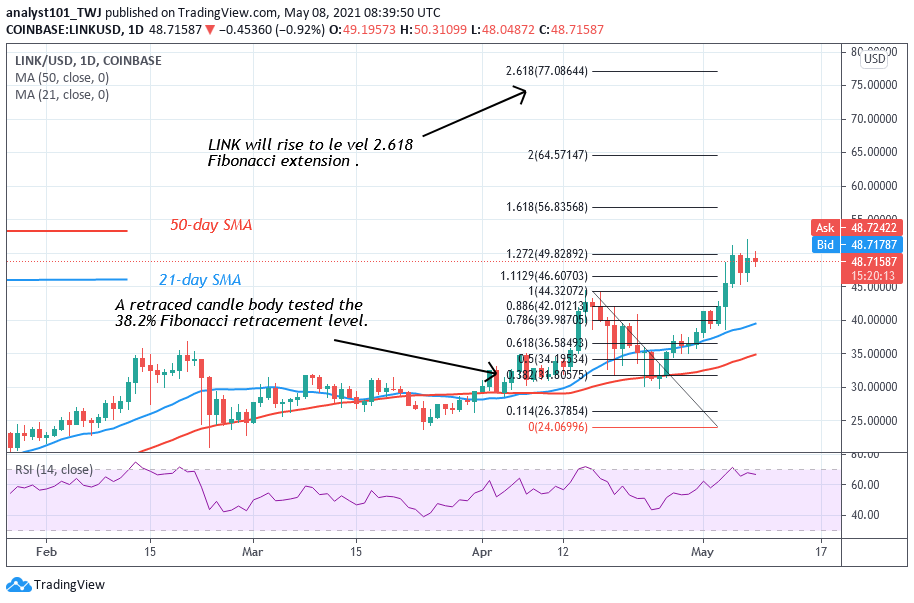
If the bulls break the $52 resistance it will signal the resumption of the uptrend. The market is likely to rise to a high of $70. On the other hand, if the bears break the $46 support, the market will decline below the $44 crucial support. Chainlink has the possibility of a further upward move. On April 15 uptrend, a retraced candle body tested the 38.2% Fibonacci retracement level. This retracement level indicates that the market will rise to level 2.618 Fibonacci extension or the high of $77.08.


