
Bitcoin bulls have consistently held on above the moving averages despite the recent retracement from the $68,000 high. A breakout above the $66,000 high will propel the cryptocurrency above the $70,000 psychological price level. The altcoins except Polkadot have advantages for further upside as the cryptocurrencies trade in the bullish trend.
BTC/USD Major Trend: Bullish
Today, Bitcoin’s (BTC) price rebounded above the current support of $62,866 as price reached the high of $64,890. For the past week, November 9, Bitcoin rallied to $68,444 high but the bulls could not sustain the bullish momentum above the recent high.
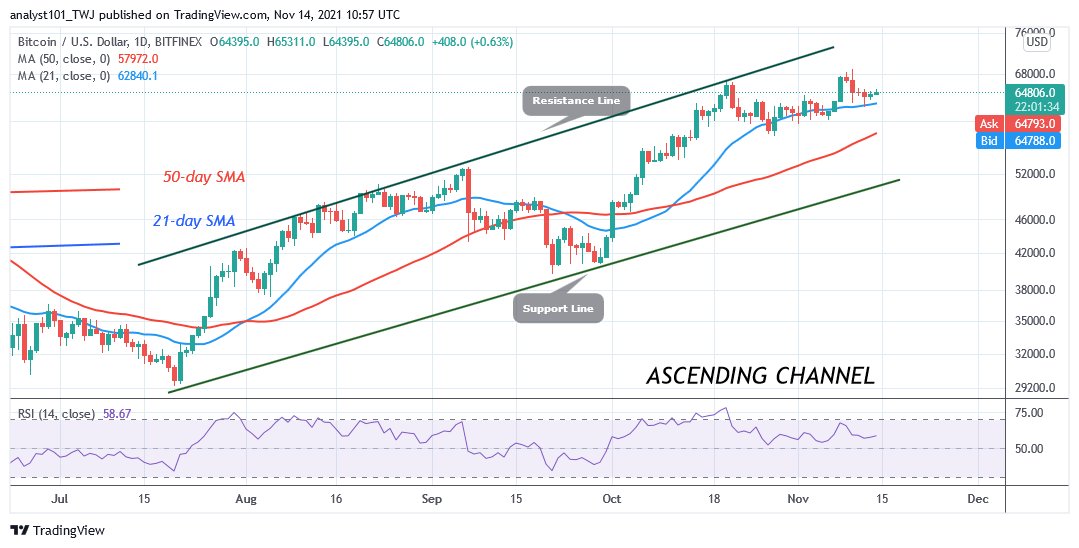
Consequently, Bitcoin slumped to $62,866 low as bulls bought the dips. For the past five days, Bitcoin has been compelled to a range-bound movement. BTC price has been fluctuating between $63,000 and $66,000 price levels. Presently, BTC price is trading above the moving averages. There is a possibility of further upsides. On the upside, if buyers clear the $66,000 resistance zone, a retest at the $68,000 is likely.
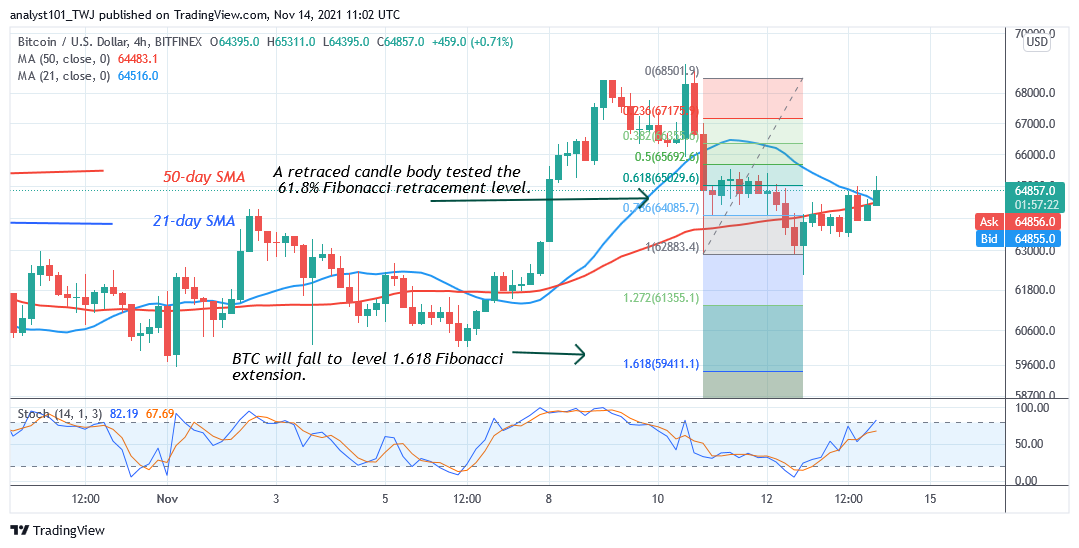
Nevertheless, if the $68,000 resistance is breached, it will signal the resumption of upside momentum. BTC’s price will rally above the $70,000 high. Conversely, if BTC price falls and the bears break below $63,000 support, the Fibonacci tool analysis will hold. Meanwhile, on November 10 downtrend, a retraced candle body tested the 61.8% Fibonacci retracement level. The retracement indicates that BTC price will fall to level 1.618 Fibonacci extension or $59,411.10.
XRP/USD Major Trend: Bullish
Since November 10 breakdown, Ripple’s (XRP) price has been in range-bound movement between $1.15 and $1.25. On November 8 uptrend; buyers were repelled at the $1.34 resistance. Ripple would have regained the previous price level at $1.41 if buyers were successful.
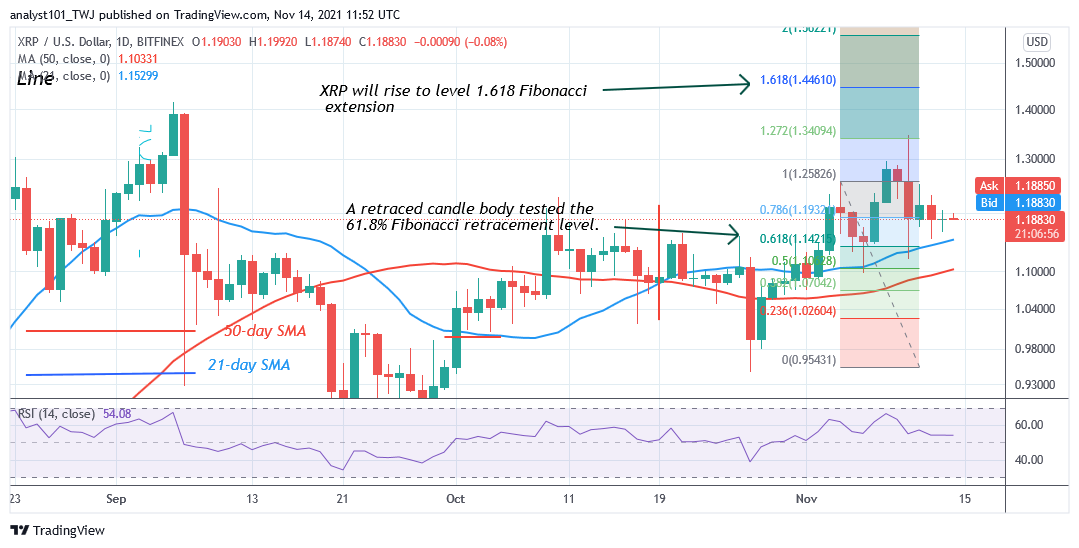
Nonetheless, there is a tendency for Ripple to rise as it trades above the moving averages. A break above the resistance at $1.34 will catapult XRP above the previous price level of $1.41. For instance, on November 4 uptrend; a retraced candle body tested the 61.8% Fibonacci retracement level. The retracement indicates that XRP price will rise to level 1.618 Fibonacci extension or $1.44. If Ripple attains the previous price level, there is the tendency for price to continue on the upside.
DOT/USD Major Trend: Bullish
On November 10, Polkadot’s (DOT) price faced rejection as it fell below the 21-day line moving average. The rejection was caused by buyers’ inability to sustain the bullish momentum above the $55 high. Today, DOT/USD is trading between the two moving averages.DOT price is below the 21-line moving average.
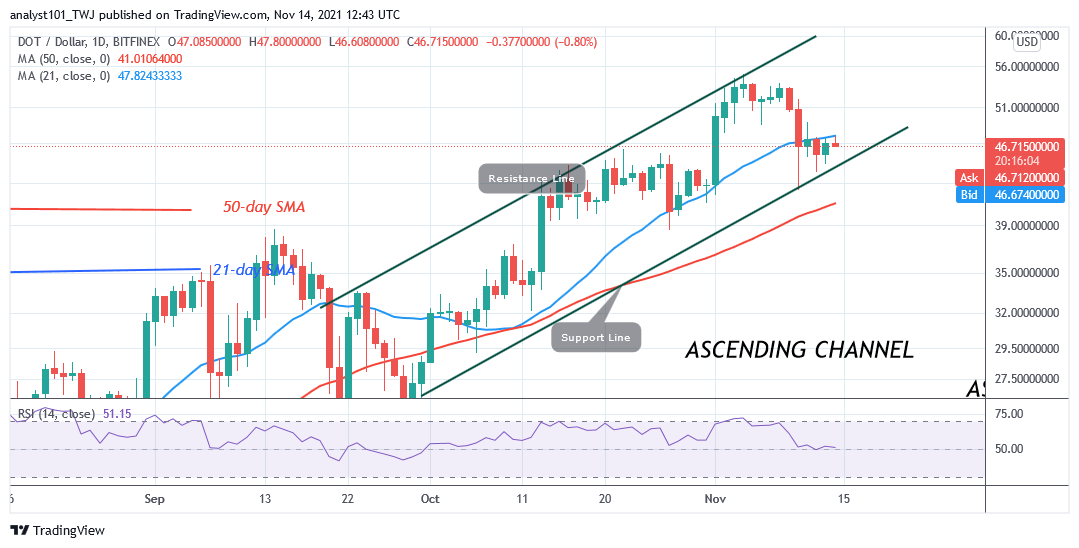
At the same time, it is above the 50-day line moving average. Polkadot has two ways of price movement. If buyers break above 21-day line moving averages, DOT price will rise on the upside. The crypto will rise to breach the $48 and $55 resistance levels. The $48 resistance level is the historical price level of May 2021. However, a break below the 50-day line moving average will push the crypto to decline on the downside. DOT/USD will sink to $32 low
LTC /USD Major Trend: Bullish
Litecoin’s (LTC) price is trading above the moving averages. On November 10 uptrend, LTC price rallied to $290 high. The market reached level 85 of the Relative Strength Index for period 14. Litecoin declined as it reached the overbought region. It declined to $250 low but corrected upward.
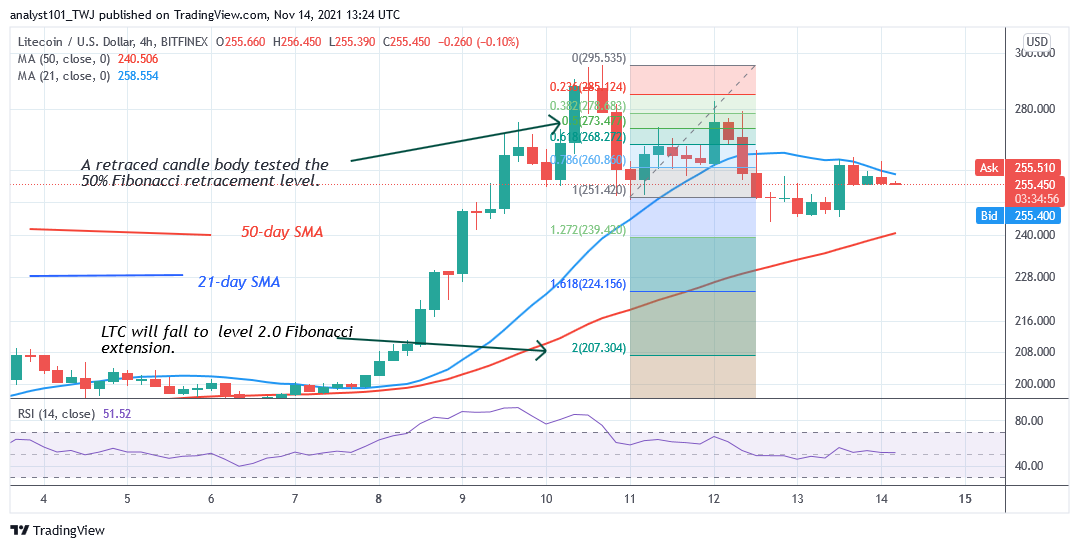
The upward correction was terminated at $250 as it resumed downward. LTC price is making a series of lower highs and lower lows. The downtrend is likely to continue. Meanwhile, on November 10 downtrend; a retraced candle body tested the 50% Fibonacci retracement level. The retracement indicates that Litecoin is likely to fall to level 2.0 Fibonacci extension or $207.30.
LINK /USD Major Trend: Bullish
Chainlink’s (LINK) price rallied to $36 but faces strong rejection. The $36 is the historical price level of September 6. Chainlink is falling because buyers fail to keep LINK price above the $36 high.
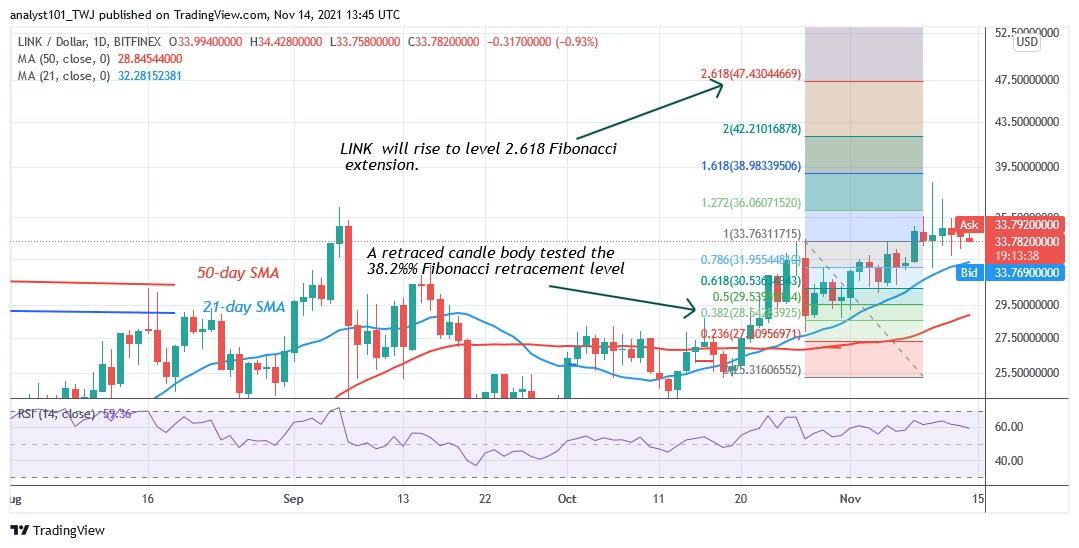
If LINK retraces and finds support above the 21-day line moving average, the uptrend will resume. Also, Fibonacci tool analysis may hold. Meanwhile, on October 27 uptrend; a retraced candle body tested the 38.2% Fibonacci retracement level. The retracement indicates that LINK will rise to level 2.618 Fibonacci extension or 47.43 high. Conversely, if LINK falls and breaks below the moving averages, the market will decline to $21.