
Bitcoin (BTC) has fallen to the bearish trend zone after buyers fail to keep prices above the $68.000 overhead resistance. BTC price is in a downward correction between $55,500 and $60,000 as bulls attempt to reclaim the $60,000 psychological price level. Similarly, the altcoins have also fallen significantly as the bear market resumes. Nevertheless, selling pressure is likely to continue this week.
BTC/USD Major Trend: Bearish
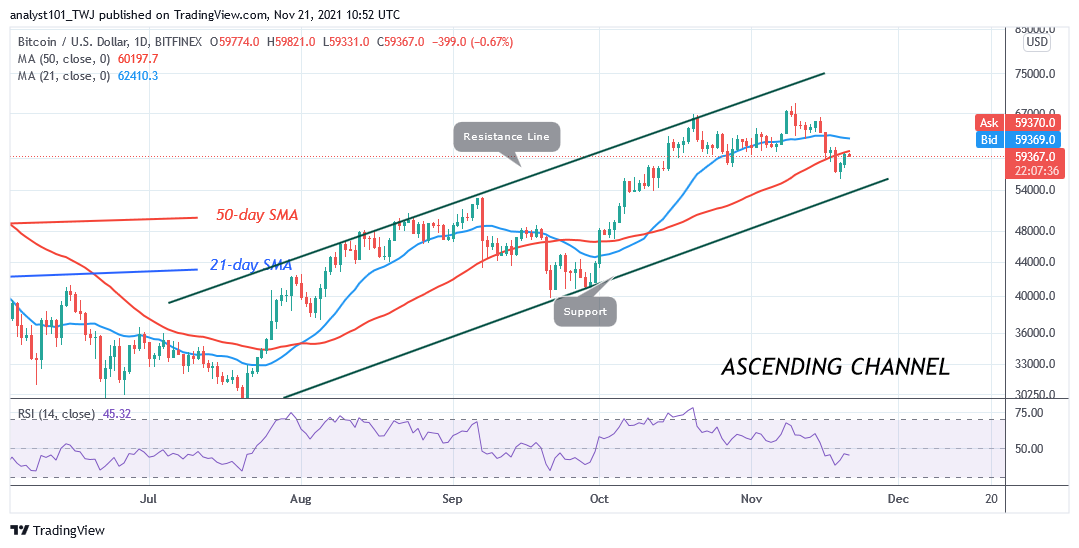
Bitcoin’s (BTC) price has plunged below the moving averages as buyers fail to keep prices above $68,000 overhead resistance. Nonetheless, the recent rejection at $66,000 has accelerated the downward move to $55,653 low. Today, buyers are attempting to push BTC prices above the $60,000 psychological price level. A breakout above $60,000 will push BTC’s price to revisit the highs of $66,000 and $68,000. Sellers have resisted the current bullish momentum as Bitcoin declines. Meanwhile, on November 12 downtrend, a retraced candle body tested the 50% Fibonacci retracement level.
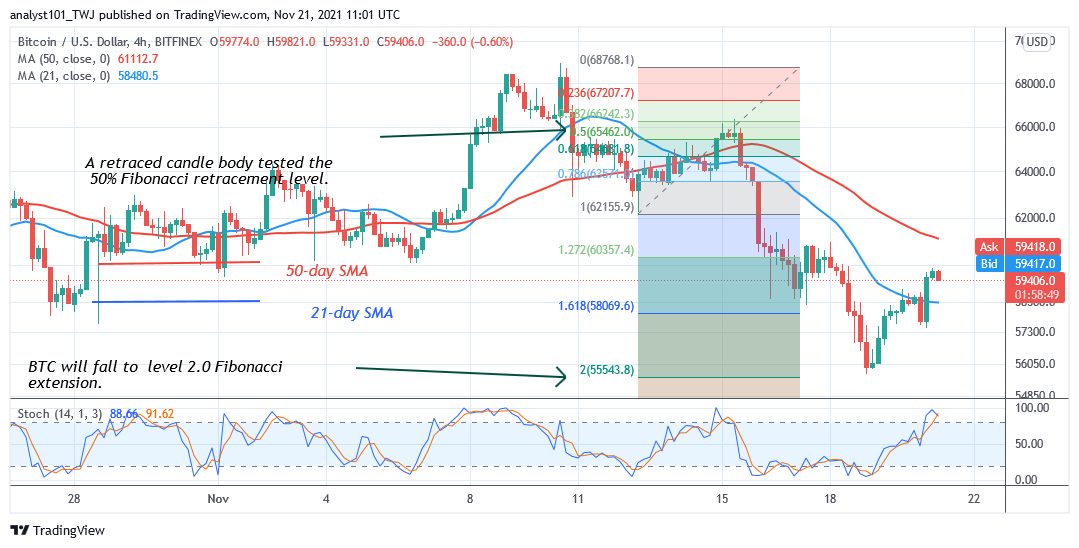
The retracement indicates that BTC price will fall to level 2.0 Fibonacci extension or $55,543.80. From the price action, BTC price fell and tested the Fibonacci extension, and pulled back. Also, the subsequent upward move is facing resistance at the $60,000 high at the time of writing. BTC/USD will be range-bound between $55,500 and $60,000 if the current levels remain unbroken. However, the market will further decline if the bears break below the $55,500 support
XRP/USD Major Trend: Bearish
Ripple’s (XRP) price has dropped sharply to $1.01 low after the resistance at $1.30. On November 8 uptrend, buyers push XRP price to the high of $1.29 but could not scale above the $1.30 resistance level.
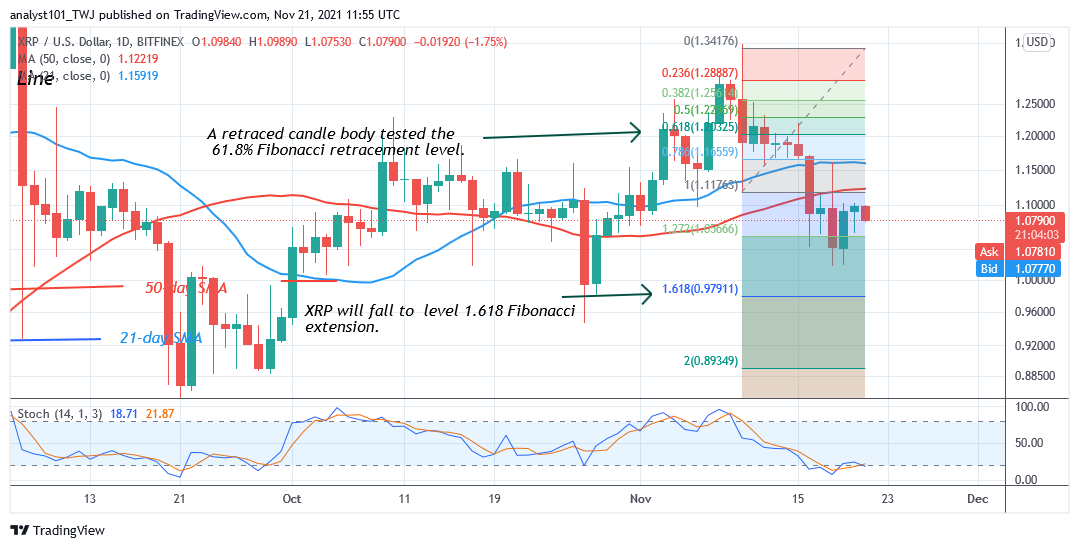
Consequently, the cryptocurrency resumed a downward move as price breaks below the moving averages. Today, the upward correction is facing rejection at $1.12. Meanwhile, on November 10 downtrend; a retraced candle body tested the 61.8% Fibonacci retracement level. The retracement indicates that Ripple is likely to fall to level 1.618 Fibonacci extension or $0.97. From the price action, Ripple has fallen to level $1.08 and it is approaching the Fibonacci extension of $0.97.
DOT/USD Major Trend: Bearish
Polkadot’s (DOT) price is trading in the bearish trend zone. DOT/USD dropped to $38 low after a recent breakdown. Since November 16, the current support has been holding as price fell to the oversold region of the market.
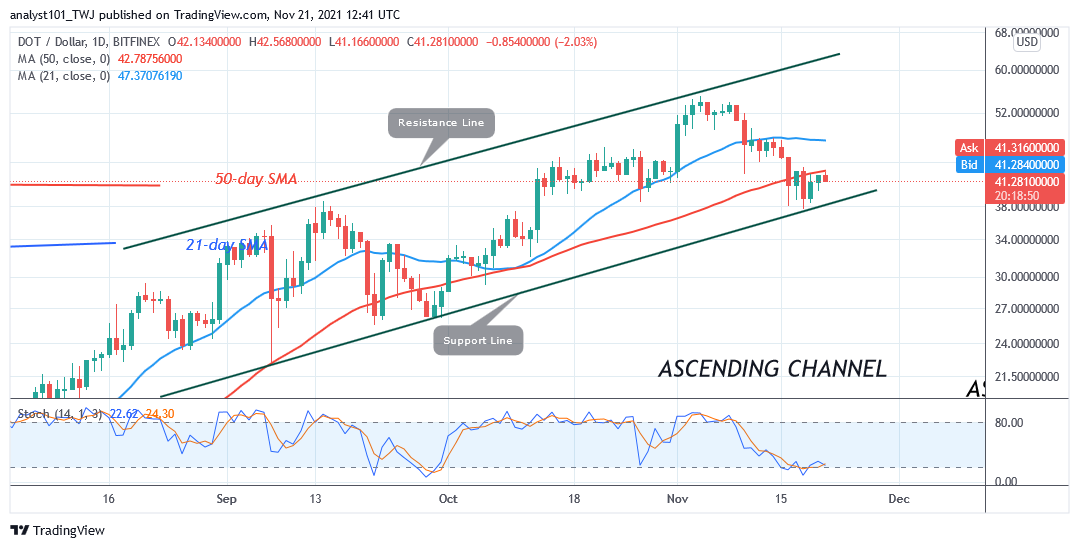
The selling pressure has subsided while the DOT price consolidates above the current support. Today, small body candlesticks are forming above the current support as buyers attempt to break above the moving averages. DOT price will rise if price rebounds above the current support. A break above the moving averages will signal the resumption of the uptrend.
LTC /USD Major Trend: Bearish
Litecoin’s (LTC) price is in a downward move as price faces rejection after reaching the high of $295. LTC price is above the 50-day line moving average but below the 21-day line moving average
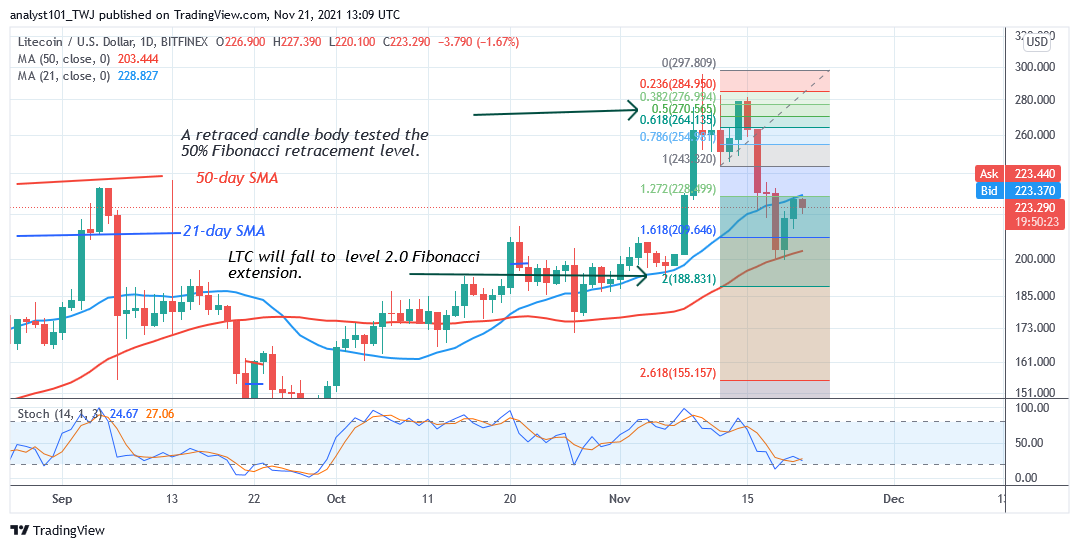
The altcoin will trend when the range-bound levels are breached. A break below the 50-day line SMA will cause the altcoin to decline to $171 low. A break above the 21-day line SMA will catapult Litecoin to rise and revisit the $260 and $280 price levels. Meanwhile, on November 12 downtrend; a retraced candle body tested the 50% Fibonacci retracement level. The retracement indicates that Litecoin is likely to fall to level 2.0 Fibonacci extension or $188.83
LINK /USD Major Trend: Bearish
Chainlink’s (LINK) price has plunged below the moving averages indicating a further downward movement of prices. The cryptocurrency reached the low of $25.89 as bulls bought the dips.
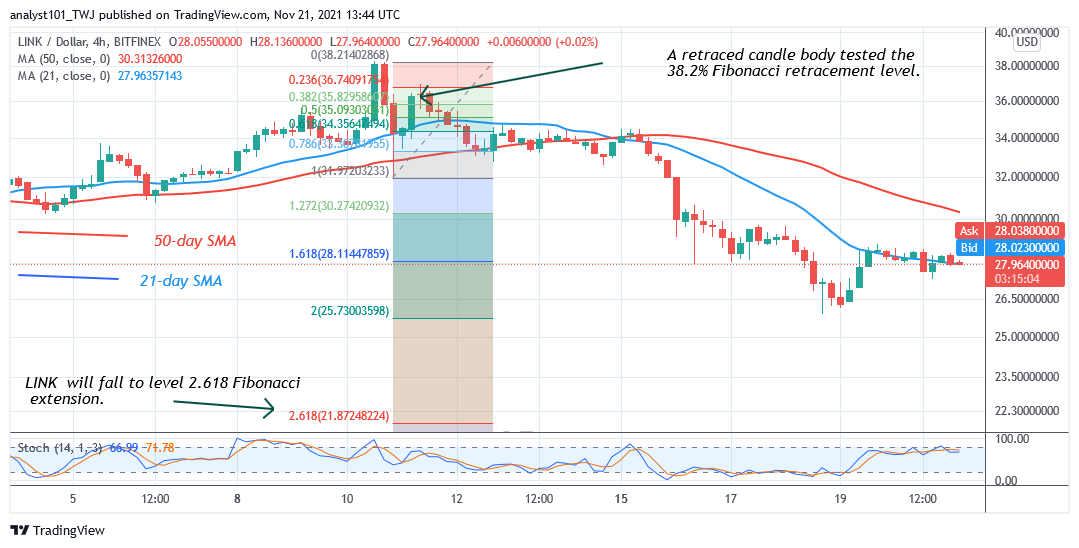
The upward correction is facing rejection at the high of $28. This is an indication of further downward movement of prices. Meanwhile, on November 10 downtrend; a retraced candle body tested the 38.2% Fibonacci retracement level. The retracement indicates that LINK will fall to level 2.618 Fibonacci extensions or $21.87. From the price action, the LTC price is rejected at $28 for a possible downward move.