
Bitcoin (BTC) has suffered another setback as the crypto plunged to $53,000 support. Buyers fail to keep BTC prices above the $58,000 high. Consequently, Bitcoin declined to the oversold region of the market. There is a tendency for further downward movement of prices. Ripple and other altcoins have fallen significantly and are trading in the oversold regions. The implication is that selling pressure is reaching bearish exhaustion.
BTC/USD Major Trend: Bearish
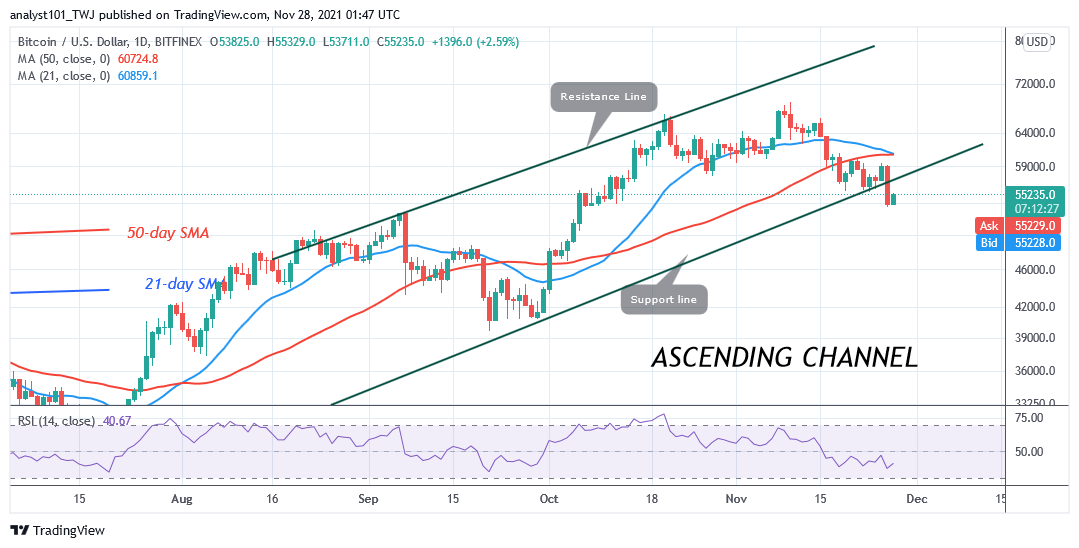
Today, Bitcoin’s (BTC) price is in a downward move as price reached the low of $53,555. Today, BTC price is correcting upward to revisit the previous highs. If buyers push the cryptocurrency above the $56,000 high and the bullish momentum is sustained, Bitcoin will fall back to the previous range bound zone of $55,700 and $58,000 price levels. Besides, buyers will attempt to push BTC price to retest the $58,000 high. Conversely, if the BTC price fails to break above the $56,000 high, there is the tendency for Bitcoin to further decline. However, if the selling pressure resumes, BTC/USD will decline to the $50,000 price level.
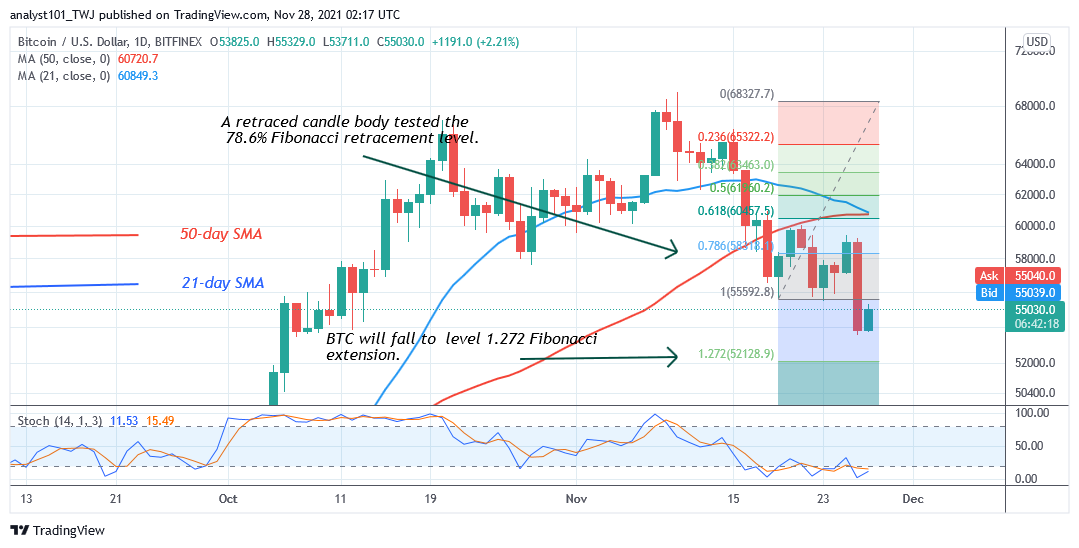
In the meantime, BTC’s price is consolidating above $53,000 support. Meanwhile, on November 19 downtrend; a retraced candle body tested the 78.6% Fibonacci retracement level. The retracement indicates that Bitcoin is likely to fall but reverse at level 1.272 Fibonacci extension or $52,128.90
XRP/USD Major Trend: Bearish
Ripple’s (XRP) price has been in a downward move as price breaks below the moving averages to reach the low of $0.88. The cryptocurrency is approaching the previous low of $0.85. XRP price has also fallen below the 20% range of the daily stochastic. Ripple has fallen to the oversold region.
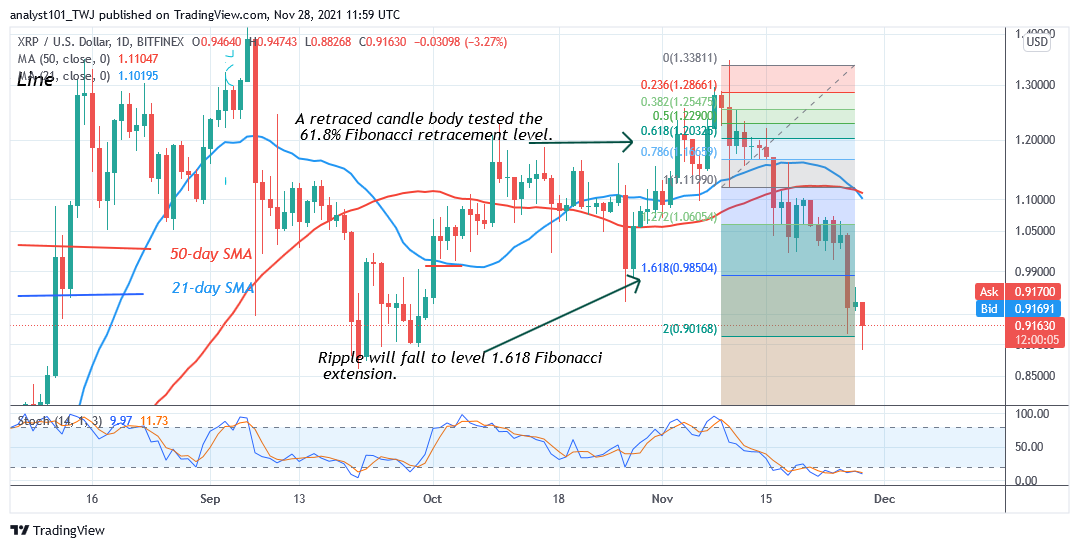
A further downward move is unlikely. Buyers are likely to emerge in the oversold region to push prices upward. Meanwhile, on November 10 downtrend; a retraced candle body tested the 61.8% Fibonacci retracement level. The retracement indicates that Ripple is likely to fall to level 1.618 Fibonacci extension or $0.98. From the price action, Ripple has fallen beyond the Fibonacci extension to reach the low of $0.88. The long candlestick tail is indicating that the current support is a strong buying pressure.
DOT/USD Major Trend: Bearish
Polkadot’s (DOT) price is in a downward move. The cryptocurrency reached the low of $32 after breaking below the moving averages. Since November 18, buyers have been defending the $38 support before the recent breakdown. The bears have broken the $38 support to reach the low of $33. The current support is the previous support of October 11. Polkadot will further decline if the current support is breached. In the meantime, the DOT price has reached the oversold region of the market.
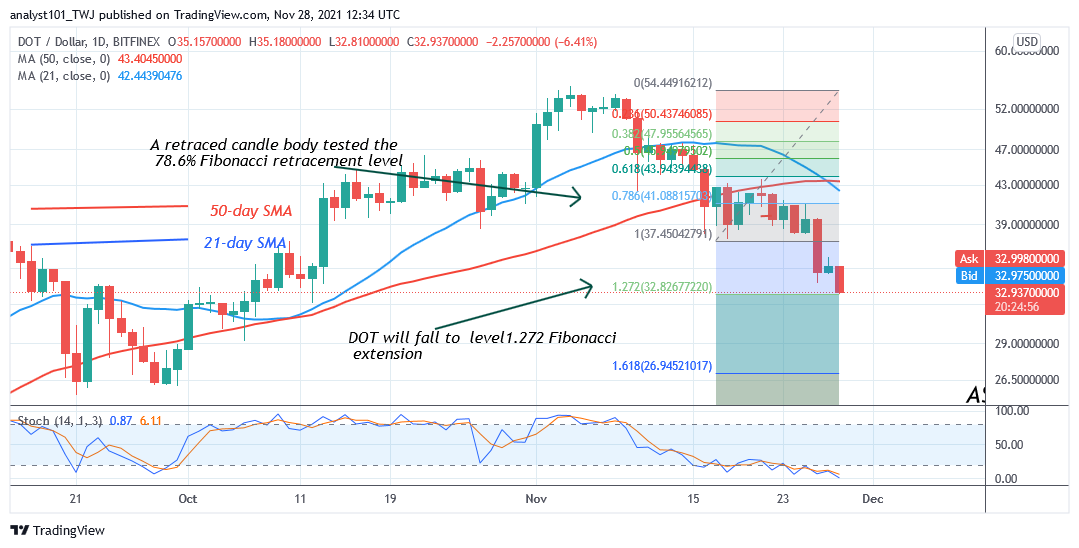
DOT price will be deeply in the oversold region if it declines. Meanwhile, on November 17 downtrend; a retraced candle body tested the 78.6% Fibonacci retracement level. The retracement indicates that Polkadot is likely to fall to level 1.272 Fibonacci extension or $32.82. From the price action, DOT price is testing the Fibonacci extension as the altcoin declines.
LTC /USD Major Trend: Bearish
Litecoin’s (LTC) price is in a downward move as price falls to the low of $189. In previous price action, Litecoin fell above the $200 support on November 18 as buyers defended the current support for over a week. On November 26, the bears broke below the $200 support to reach the low of $189.
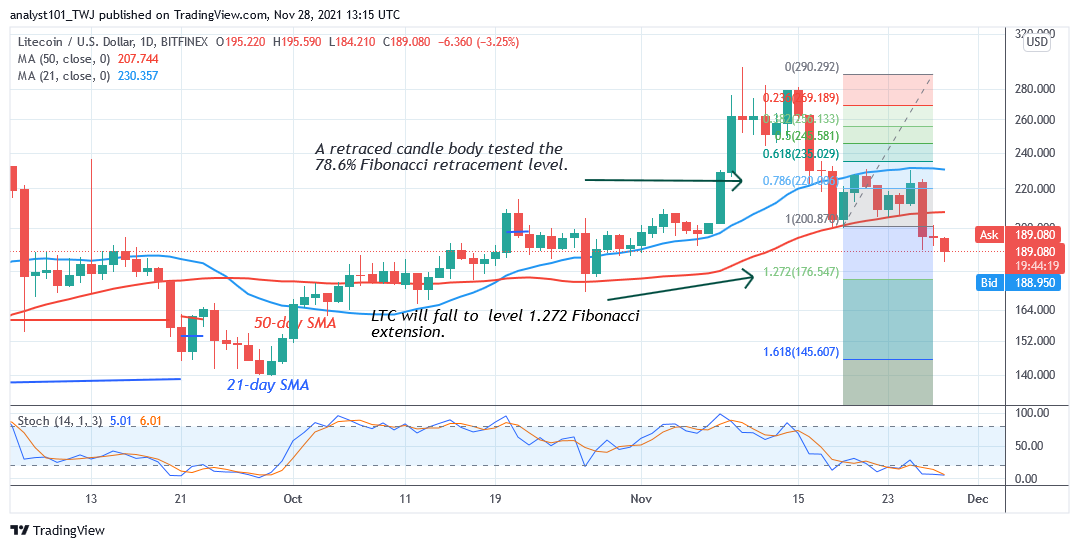
The current price level has reached the oversold region indicating that the selling pressure has reached bearish exhaustion. Meanwhile, on November 19 downtrend; a retraced candle body tested the 78.6% Fibonacci retracement level. The retracement indicates that Litecoin is likely to fall but reverse at level 1.272 Fibonacci extension or $176.54
LINK /USD Major Trend: Bearish
Chainlink’s (LINK) price is in a downtrend as the cryptocurrency fall to the low of $23.39. The bears break below the moving averages and the previous low at $26. Chainlink also fell to the oversold region of the market. The implication is that the current selling pressure is likely to reach bearish exhaustion.
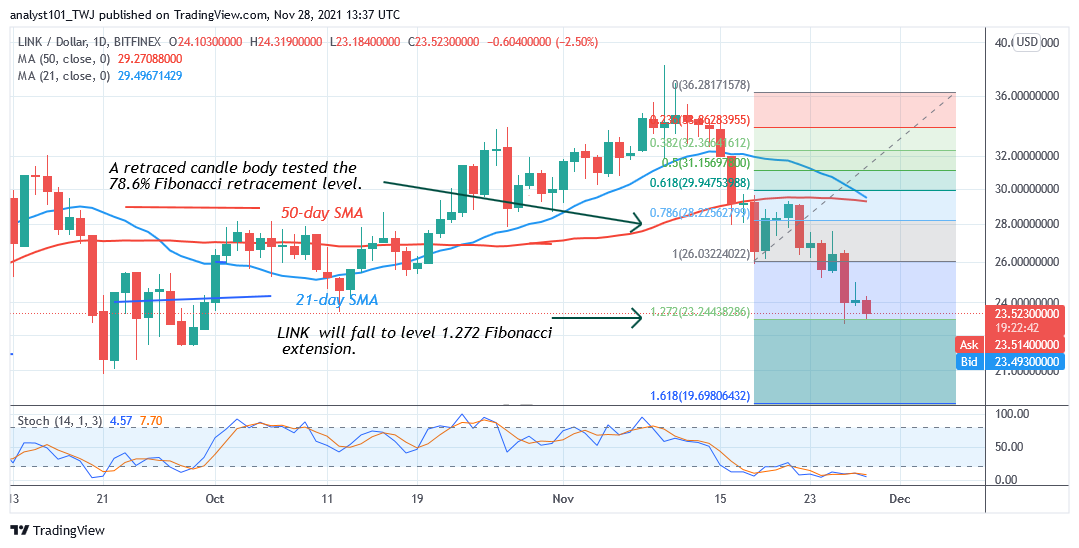
Meanwhile, on November 18 downtrend; a retraced candle body tested the 78.6% Fibonacci retracement level. The retracement indicates that LINK will fall but reverse at level 1.272 Fibonacci extensions or $23.24. From the price action, the LINK price is testing the Fibonacci extension as price falls.