
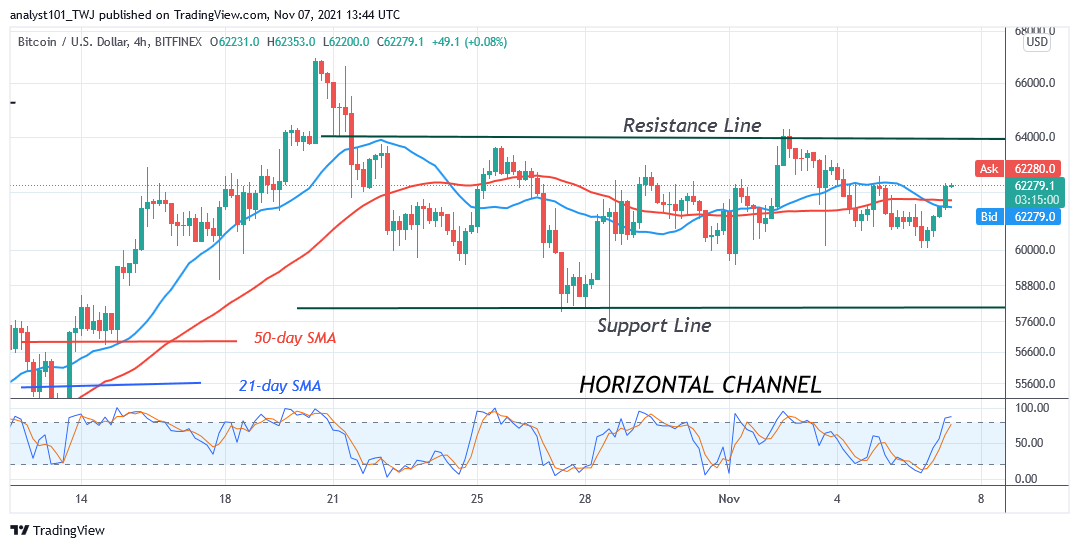
Since October 20, Bitcoin has been compelled to a sideways move as buyers failed to regain the $67,000 price level. For over two weeks, the cryptocurrency has been confined between $58,000 and $64,000 price levels. Buyers have made concerted efforts to keep the price above $64,000. Similarly, the altcoins, namely Ripple, Polkadot, Litecoin, and Chainlink are trading in the bullish trend zones. Buyers are struggling to reclaim the previous highs.
BTC/USD Major Trend: Bullish
Bitcoin’s (BTC) price has resumed a downward move as price breaks below the 21-day line moving average. The current downtrend was caused by bulls’ failure to keep BTC prices above the $64,000 high. On October 25, buyers came close to breaching the $64,000 resistance but were repelled.
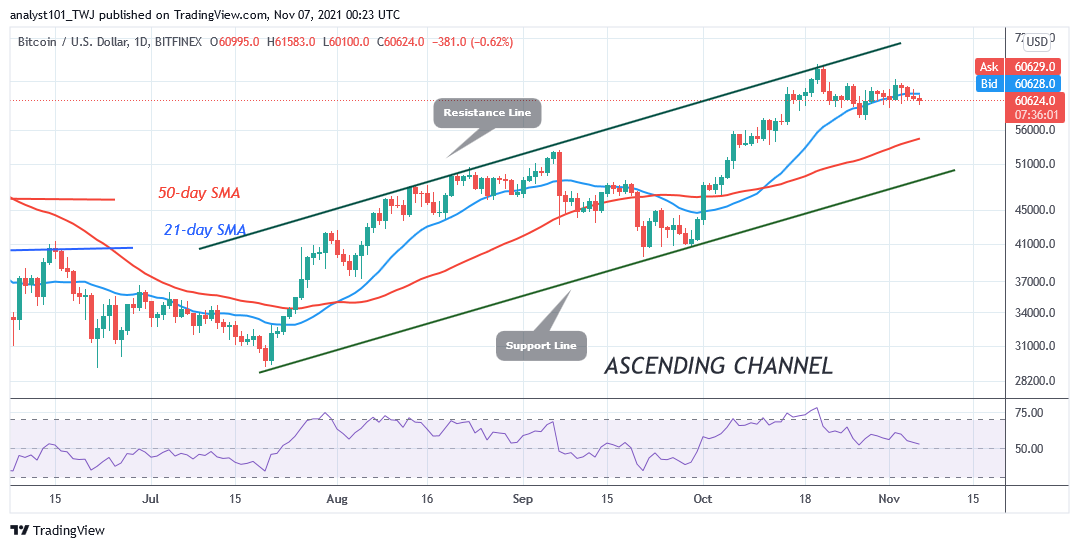
BTC price declined to $58,000 low as bulls bought the dips. On November 2, the bulls retested the $64,000 high and were resisted again. BTC/USD has continued to fall after the second rejection. As price breaks below the 21-day line moving average, the cryptocurrency is likely to fall and revisit the previous low of 58,000.
However, if the $58,000 support cracks, Bitcoin will further decline to $55,000 low. Meanwhile, the BTC price is hovering above the $60,000 crucial support. Bitcoin will regain bullish momentum if the support holds.
XRP/USD Major Trend: Bullish
Ripple’s (XRP) price is retracing after rejection from the $1.25 overhead resistance. Since October 9, Ripple has been in a range-bound move as the crypto was confined between $1.00 and $1.20 price levels. Today, the cryptocurrency has declined to $1.09 low and above the 21-day line moving average.
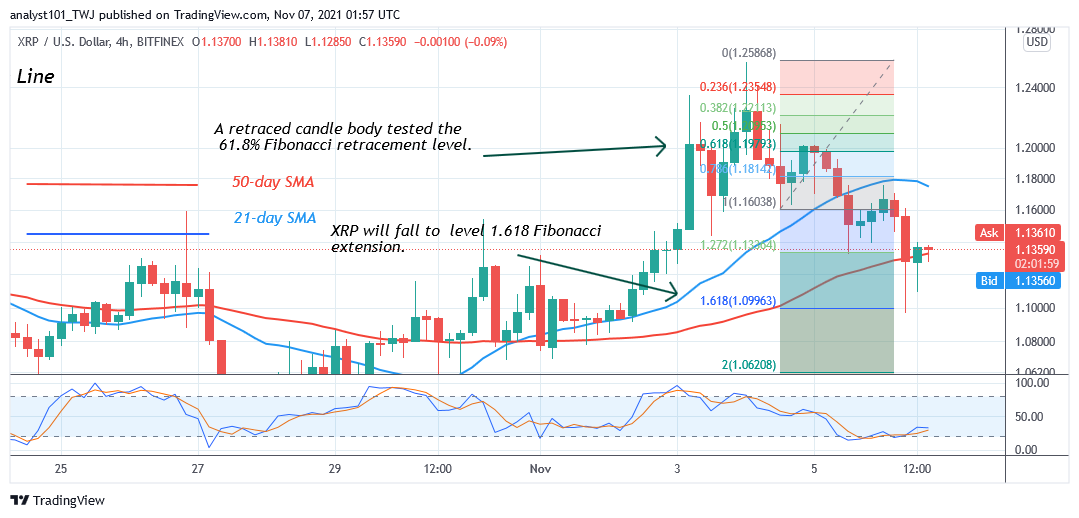
The uptrend will resume if the bulls clear the resistance levels at $1.20 and $1.25. Today, The market will rise as price finds support above the 21-day line moving averages. Meanwhile, on November 4 downtrend; a retraced candle body tested the 61.8% Fibonacci retracement level. The retracement indicates that XRP price will fall to level 1.618 Fibonacci extension or level $1.09. From the price action, Ripple has fallen to the Fibonacci level as shown by the long candlestick tail. Ripple will rise and revisit the previous high at $1.41.
DOT/USD Major Trend: Bullish
Polkadot’s (DOT) price is trading above the moving averages as the cryptocurrency rises to retest the previous high of $54. Before the recent breakout, the crypto has been in an upward correction for two weeks. The market is rising to reclaim the $54 high. DOT/USD is likely to reach the high of $58 if the bulls breach the $54 high.
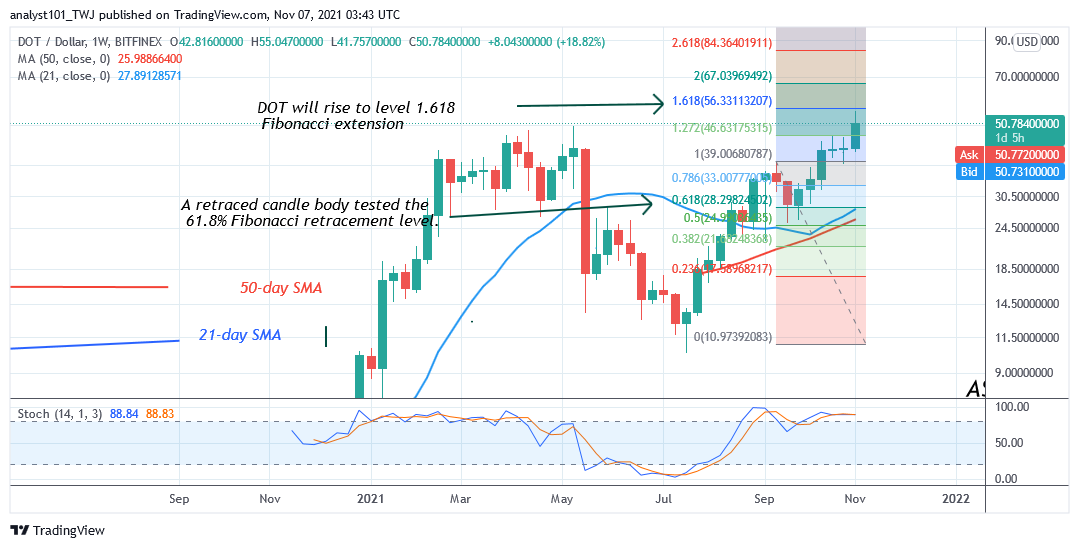
Meanwhile, on a weekly chart, and on September 13 uptrend, a retraced candle body tested the 61.8% Fibonacci retracement level. The retracement indicates that the DOT price will rise to level 1.618 Fibonacci extension or level $56.33. From the price action, the market is approaching a high of $51. However, DOT price has reached above 80% range of the daily stochastic. The market has reached the overbought region of the market. Sellers are likely to emerge in the overbought region.
LTC /USD Major Trend: Bullish
Litecoin’s (LTC) price is still trading above the moving averages but the uptrend has been hindered at the $210 resistance level. For the past five days, Litecoin has been falling after rejection at the recent high.
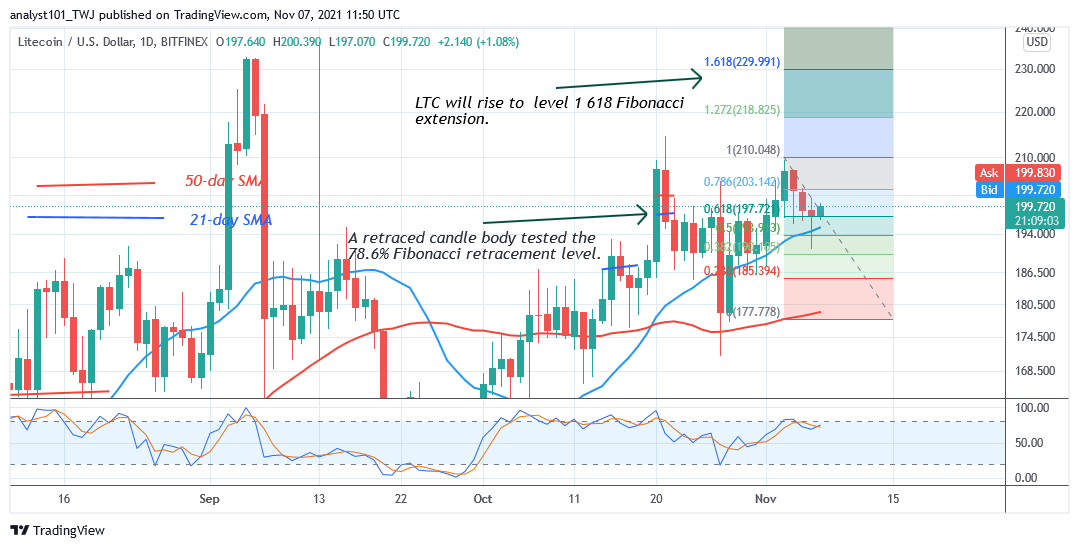
LTC has fallen and found support above the 21-day line moving average. This indicates that buyers are likely to initiate a new uptrend. . Nevertheless, if buyers clear the resistance levels of $200 and $210, the market will rally to the previous high of $230. Meanwhile, on November 3 uptrend; a retraced candle body tested the 61.8% Fibonacci retracement level. The retracement indicates that Litecoin is likely to rise to level 1.618 Fibonacci extension or $229.99.
LINK /USD Major Trend: Bullish
Chainlink’s (LINK) price has sustained recent rallies above the moving averages. For the past three days, Chainlink has been in a downward move. The present retracement has ended above $30 support. The 21-day line moving average is holding as the crypto resumes an upward move.
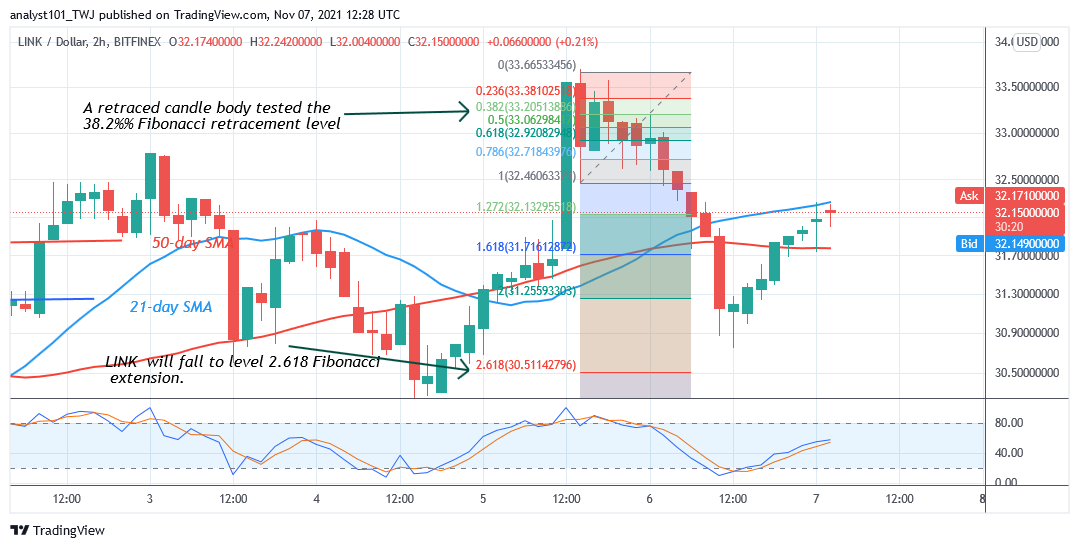
Meanwhile, on November 5 downtrend; a retraced candle body tested the 38.2% Fibonacci retracement level. The retracement indicates that LINK will fall to level 2.618 Fibonacci extension or $30.42 high. Chainlink has reversed after reaching the low of $30.75. Today, the cryptocurrency has resumed an upward move to retest the $34 resistance zone. A break above the $34 high will propel the altcoin to rally above $36.