Bitcoin’s (BTC) price has broken above the $60,000 psychological price level to reach a high of $62,900. Bitcoin is retracing as it hovers above the $60,000 support. Bitcoin risks further decline as the cryptocurrency trades in the overbought region of the market. Ripple and the three altcoins above are making positives moves on the upsides.
BTC/USD Major Trend: Bullish
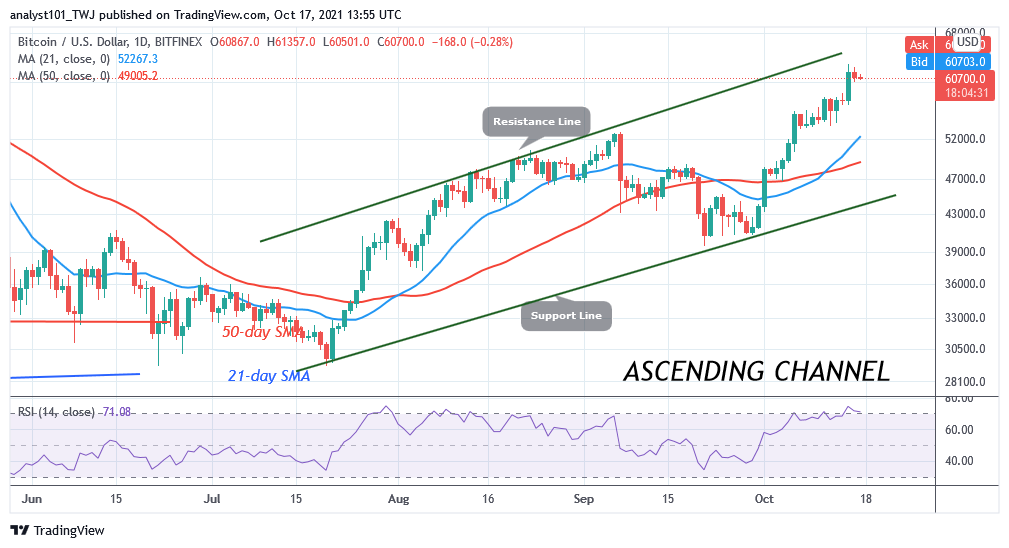
On October 15, BTC/USD rebounded above the $56,881 support to reach a new high of $62,900. At the recent peak price of Bitcoin, the market is said to be overbought. Sellers have already emerged in the overbought region as Bitcoin retraces to the downside. As the crypto retraces, BTC prices will fall to the low above $57,000. Meanwhile, Bitcoin has fallen above the $60,000 price level as buyers resist the further downward move.
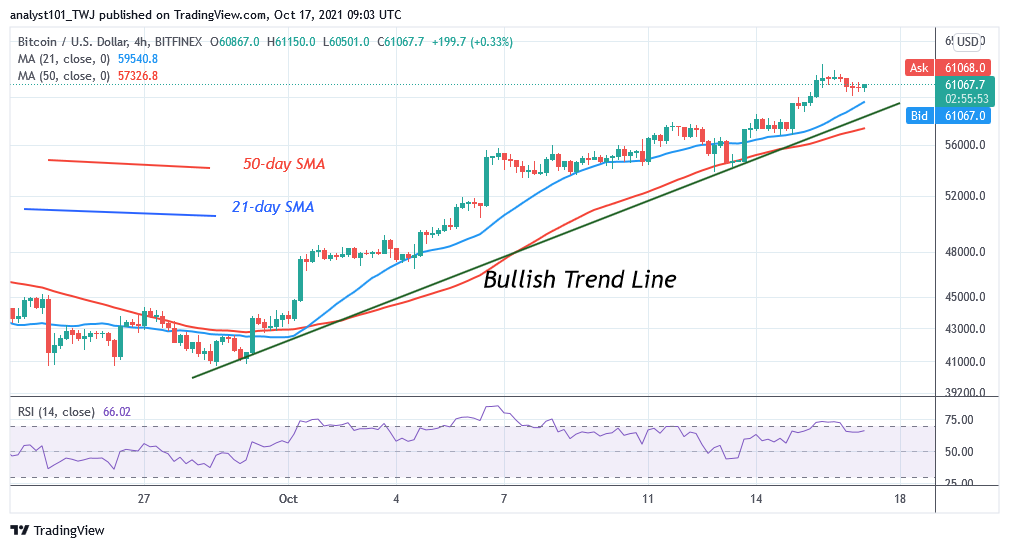
Moreover, small body candlesticks have emerged in the lower time frame. These candlesticks called Doji and Spinning tops are describing that buyers and sellers are undecided above the direction of the market. The bottom line is that Bitcoin will fall as the market is seriously overbought.
XRP/USD Major Trend: Bullish
On a higher time frame, Ripple’s (XRP) price is trading in the bullish trend zone. This suggests that the altcoin is likely to rise on the upside. However, the present price action is characterized by small body candlesticks called Doji and Spinning tops. These candlesticks are responsible for the range-bound movement of the cryptocurrency.
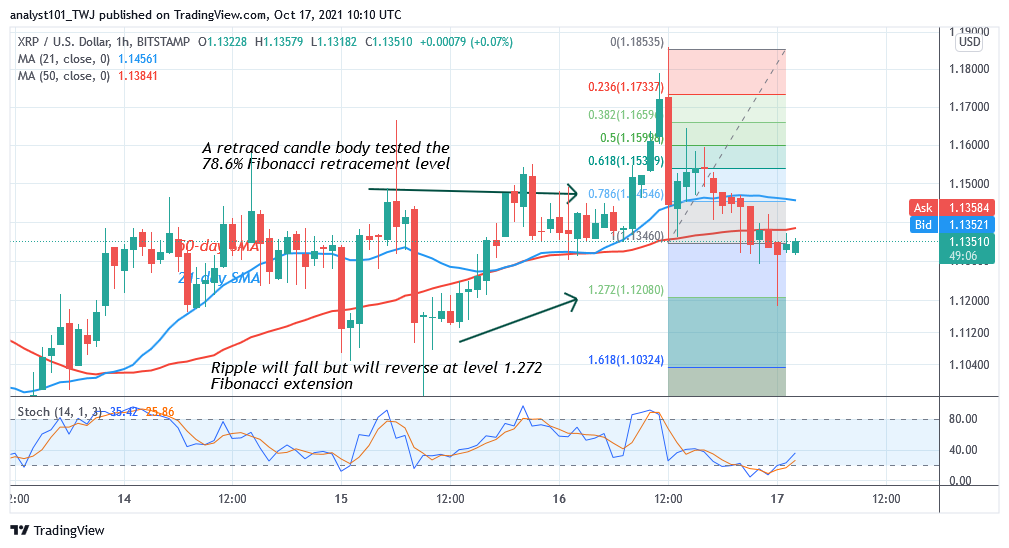
In the present chart, the cryptocurrency has been falling after a rally to the high of $1.18. Ripple is expected to fall to the low of 1.12 and resume an upward move.Meanwhile, on October 16 downtrend; a retraced candle body tested the 78.6% Fibonacci retracement level. The retracement indicates that XRP price will fall but reverse at level 1.272 Fibonacci extension or level $1.12. From the price action, the cryptocurrency has already fallen and tested the Fibonacci level. This week, Ripple is likely to resume an upward move.
DOT/USD Major Trend: Bullish
Polkadot’s (DOT) price is making positive moves as price breaks above the moving averages. Since October 13, buyers have been struggling to break above the $42 resistance.
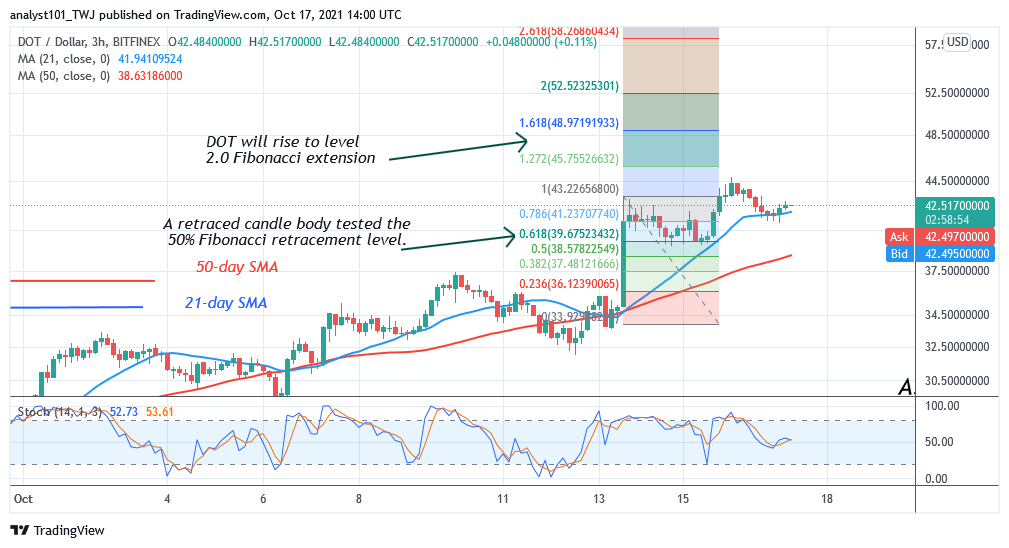
The bulls have been repelled twice at the resistance levels. However, if the current resistance level is breached the altcoin will rally to $50. The Fibonacci tool has indicated a possible upward move of the cryptocurrency. Meanwhile, on October 13 uptrend; a retraced candle body tested the 61.8% Fibonacci retracement level. The retracement indicates that XRP price will rise to level 1.618 Fibonacci extension or level $48.97. From the price action, buyers are still struggling to break the resistance at $42.
LTC /USD Major Trend: Bullish
Since October 6, Litecoin’s (LTC) price is trading above the moving averages. The upward move has been stalled at the resistance of $185. The current uptrend will resume if the resistance is breached and the bullish momentum is sustained. Litecoin will rise and revisit the previous high of $232.
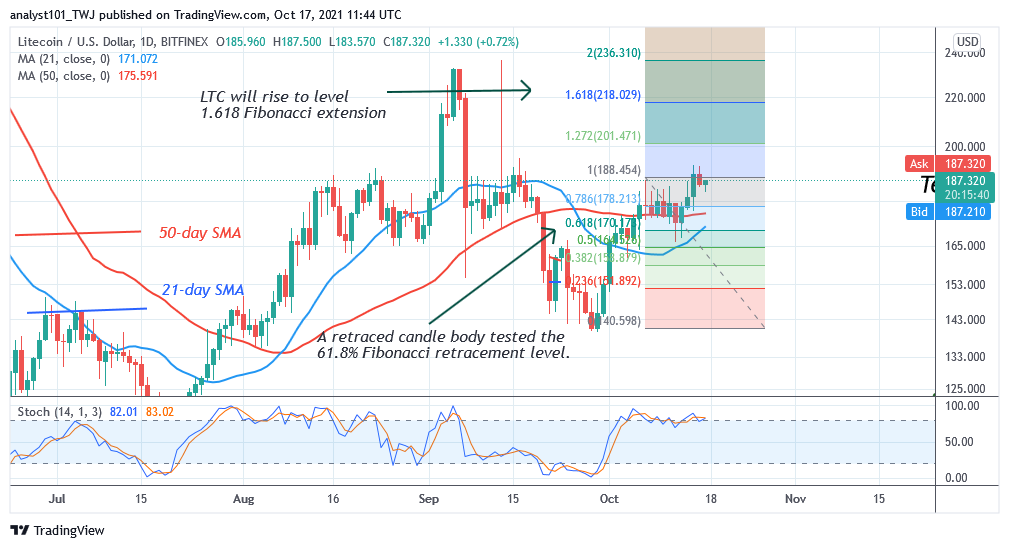
However, the cryptocurrency is presently trading in the overbought region. LTC/USD will decline if the bulls fail to break above the recent high. Sellers are likely to emerge in the overbought region to push prices down. Meanwhile, on October 7 uptrend; a retraced candle body tested the 61.8% Fibonacci retracement level. The retracement indicates that Litecoin is likely to rise to level 1.618 Fibonacci extension or level $218.02.
LINK /USD Major Trend: Bullish
Chainlink’s (LINK) price has broken above the moving average as the altcoin trades in the bullish trend zone. On October 16, the bulls breached the resistance at $27 but the bullish momentum could not be sustained. LTC price pulled back to support above the 21-day SMA.
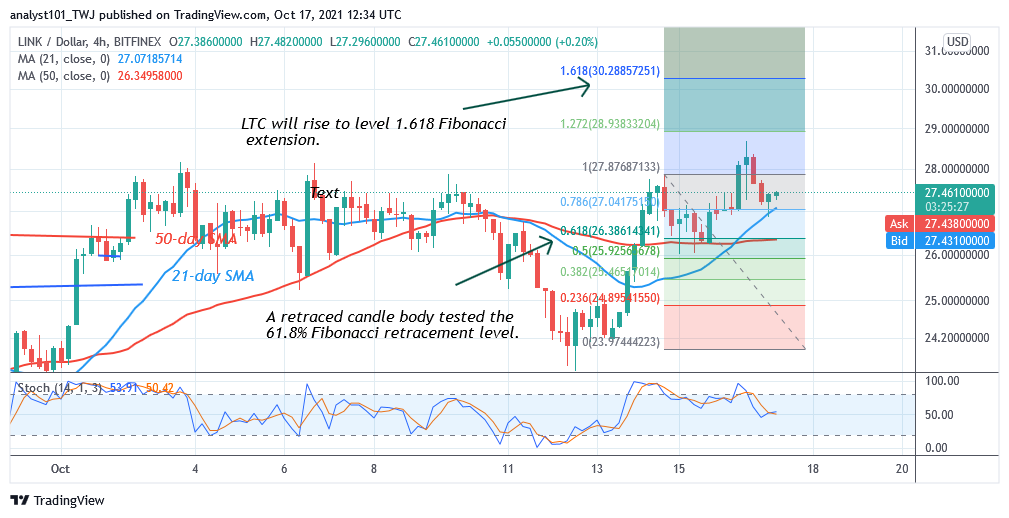
The altcoin will continue to rise higher if the bulls reclaim the $28 support. That is, if the bullish momentum is sustained, the cryptocurrency will attain a new high of $31 and $35. Meanwhile, on October 14 uptrend; a retraced candle body tested the 61.8% Fibonacci retracement level. The retracement indicates that LINK is likely to rise to level 1.618 Fibonacci extension or level $30.28.


