
Bitcoin and the other cryptos have been in upward moves. The uptrend is likely to continue as price breaks above the moving averages. However, the continuity of the uptrend is doubtful as cryptos trade in the overbought region. Nevertheless, the cryptos will survive the overbought condition of the market in a strong trending market.
BTC/USD Major Trend: Bullish
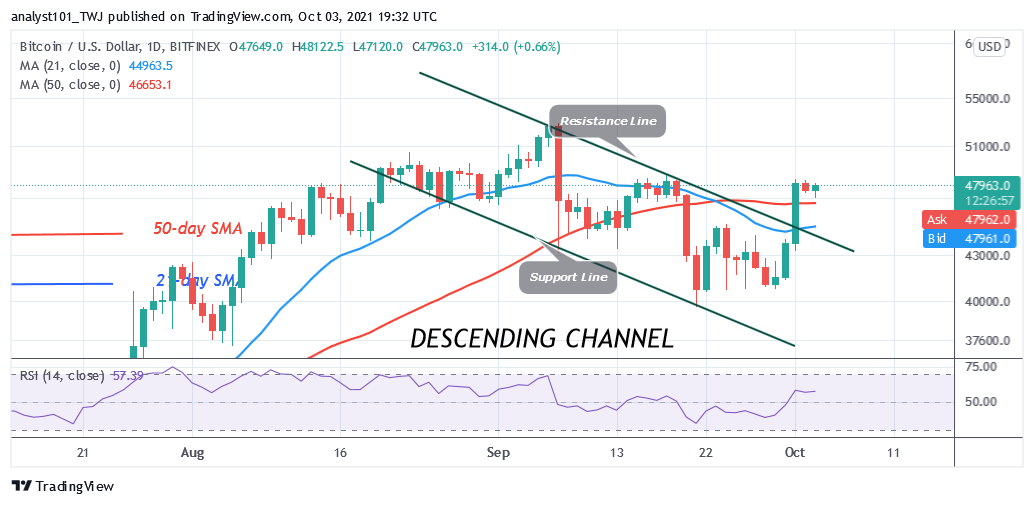
Bitcoin’s (BTC) price has broken above the moving averages as it trades in the bullish trend zone. Bitcoin reached the high of $48,464 but was resisted. The crypto is now consolidating below the $48,000 resistance zone. The current price level is the historical price level of September 18. On October 1, buyers could not penetrate the previous resistance level. Nonetheless, the market is said to reach the overbought region. In a strong trending market, this price level ought to be broken. A breakout at this level will propel the crypto to rally above the $50,000 psychological price level.
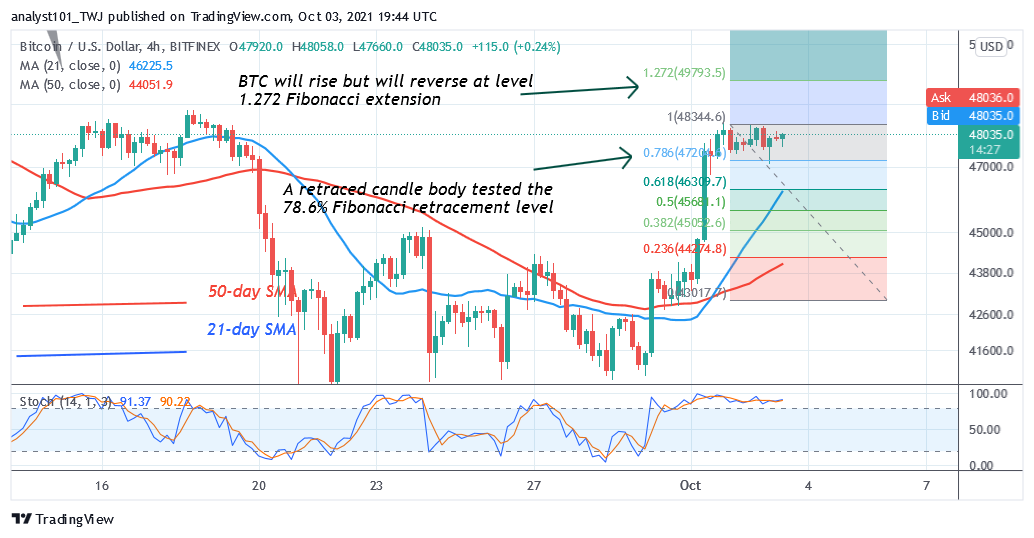
In previous price action, the bulls were resisted at the same price level in September as the crypto dropped to $40,000 low. Meanwhile, on October 2 uptrend; a retraced candle body tested the 78.6% Fibonacci retracement level. The retracement indicates that BTC price will rise but reverse at level 1.272 Fibonacci extension or level $49,793.50. From the price action, BTC’s price is trading the $48,000 resistance zone at the time of
XRP/USD Major Trend: Bullish
Ripple’s (XRP) price has broken above $1.02 resistance as price reached the high of $1.07. Buyers were repelled at the recent high as price retraced to retest the $1.0 support. The current upward move is likely to resume on the upside as price retested the $1.00 support.
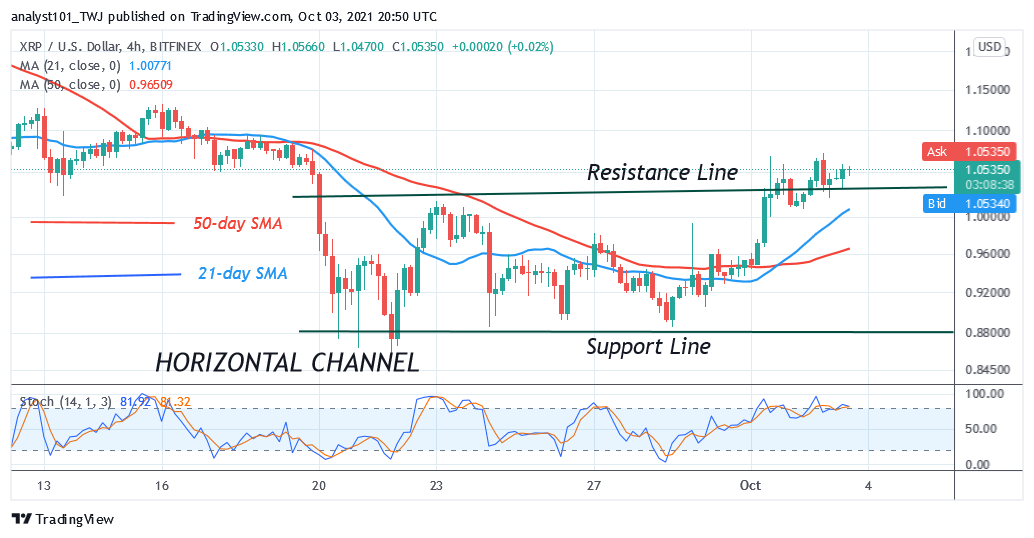
However, the uptrend is likely to be short-lived as the crypto trades in the overbought region. If sellers emerge in the overbought region, XRP will decline to the range-bound zone. In the previous action, XRP was fluctuating between $0.88 and $1.02 before the recent breakout. On the upside, if the crypto rebounds above the $1.00 support, XRP will rally above $1.20. In the meantime, the altcoin is trading at $1.05 at the time of writing.
DOT/USD Major Trend: Bullish
Polkadot’s (DOT) price has broken above the moving averages. DOT price has closed above the moving averages but the upward move is facing resistance. Polkadot will resume upside momentum if the current bullish momentum is sustained. On October 2, the DOT price fell to the low of $31 as the altcoin resumes consolidation above the current support.
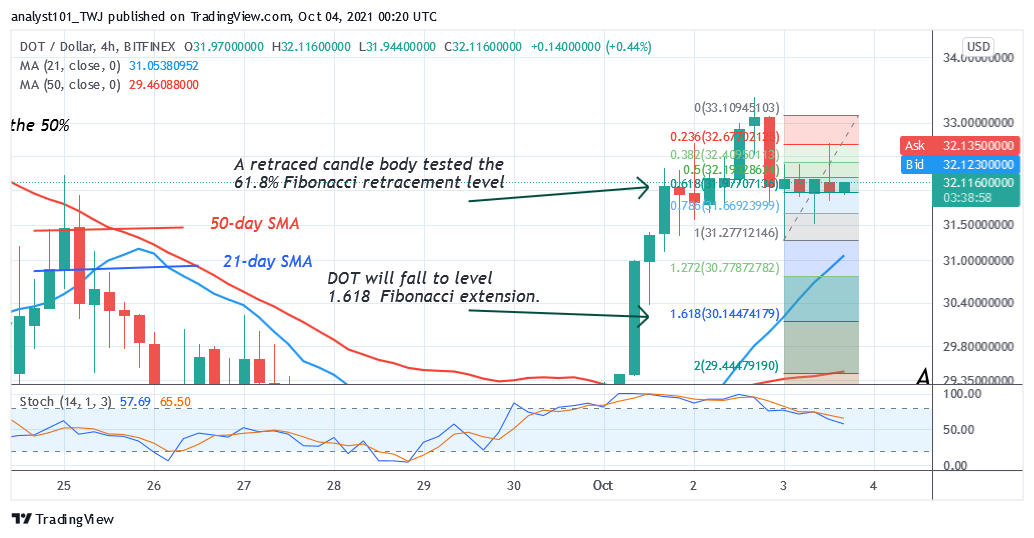
The uptrend will resume if price rebounds above the $31 support. However, if Polkadot loses the current support, DOT/USD will decline to retest the Fibonacci extension level. Meanwhile, on October 2 downtrend; a retraced candle body tested the 61.8% Fibonacci retracement level. The retracement indicates that DOT price will fall to level 1.618 Fibonacci extensions or level $30.14.
LTC /USD Major Trend: Bullish
LTC/USD price has broken above the 21-day SMA as the altcoin continued its upward move. The crypto will continue an upward move if price breaks above the 50-day SMA. Meanwhile, the upward move is facing resistance at level $172. For the past 48 hours, the bulls are retesting the recent high to break above it but were repelled.
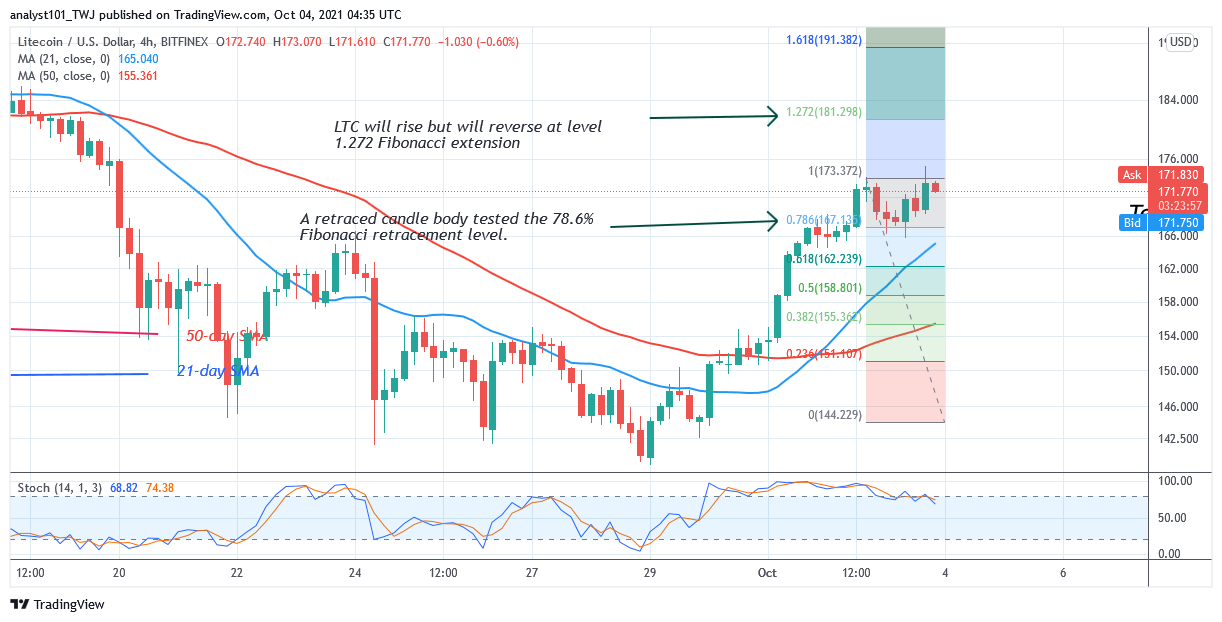
On the upside, a break above the resistance will compel the coin to rise. However, the uptrend will be short-lived as the market approaches the overbought region. Meanwhile, on the 4- hour chart, the Fibonacci tool has indicated a possible rise of the coin. Meanwhile, on October 2 downtrend; a retraced candle body tested the 78.6% Fibonacci retracement level. The retracement indicates LTC will rise but will reverse at level 1.272 Fibonacci extension or level $181.29. The market is rising and approaching the Fibonacci level.
LINK /USD Major Trend: Bullish
Chainlink’s (LINK) price has been making impressive moves it broke above the moving averages. Today, the resistance at $27 has been broken as the altcoin makes upward moves. The upward movement will continue as long as the price bars are above the moving averages.
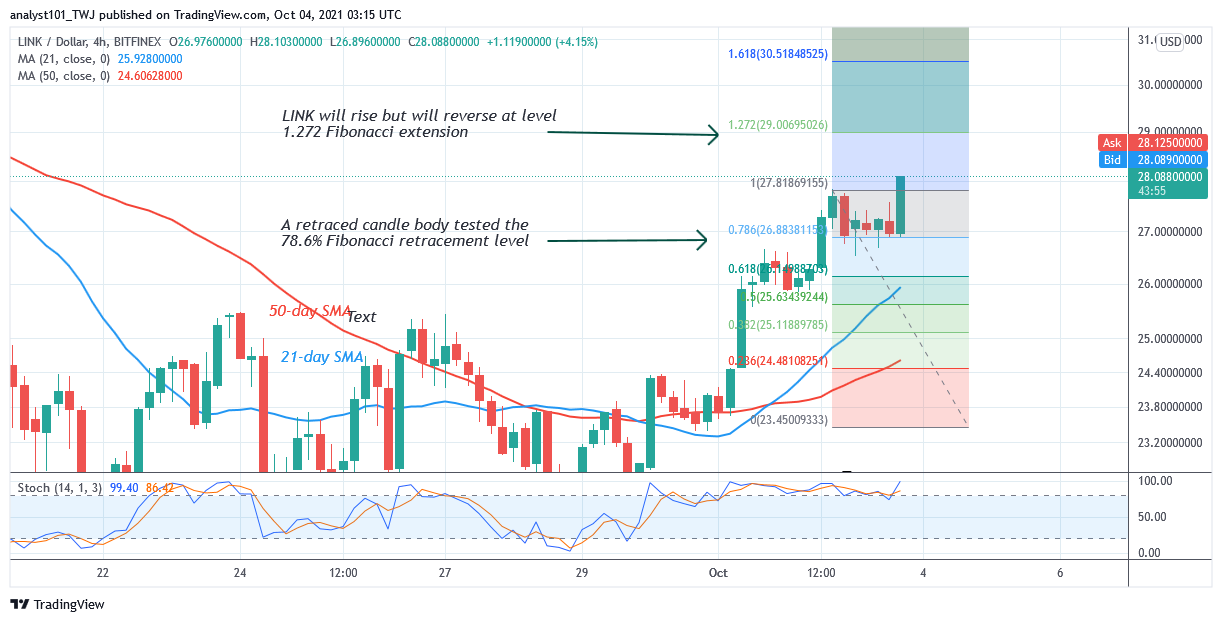
Presenting, Chainlink is trading in the overbought region as it is above the 80% range of the daily stochastic. In a strong trending market, the overbought condition may not hold. The crypto will continue to rise on the upside. Meanwhile, on October 2 uptrend; a retraced candle body tested the 78.6% Fibonacci retracement level. The retracement indicates that LTC will rise but will reverse at level 1.272 Fibonacci extension