
Since October 5, Bitcoin bulls have sustained recent rallies above the $50,000 high. The $50,000 support is likely to hold in October. Meanwhile, Ripple and the other altcoins are trading in the bullish trend zone for possible upsides.
BTC/USD Major Trend: Bullish
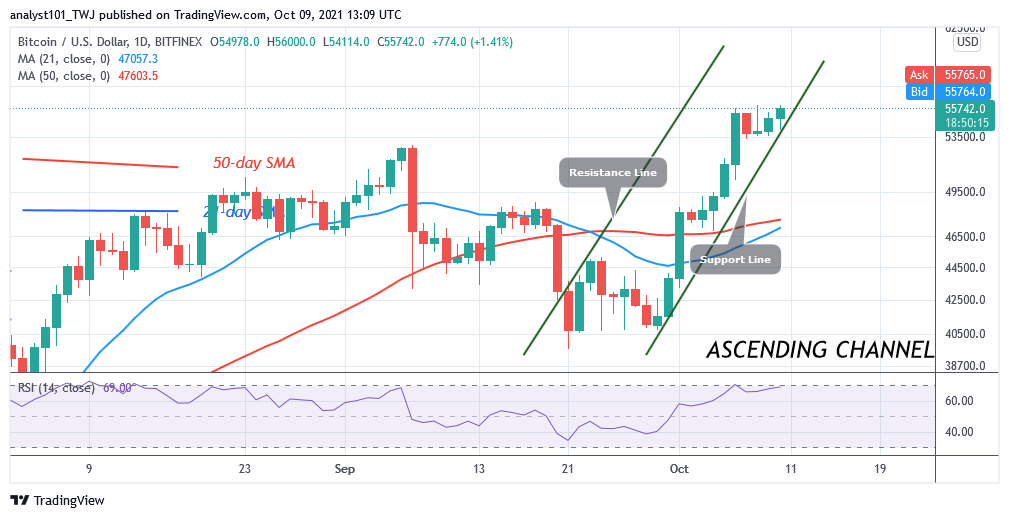
Since October 1, Bitcoin bulls have broken above the $48,000 and the $52,888 resistance levels.BTC price rallied to $55,743 but faced rejection at the $56,000 resistance zone. Since October 6, the upward move has been compelled to a sideways move. BTC price now fluctuates between $54,000 and $56,000 price levels. Buyers have retested the recent high on three occasions but were repelled. Presently, the price indicator has shown that Bitcoin has not enough room to rally on the upside. BTC price is at level 67 of the RSI period i4.
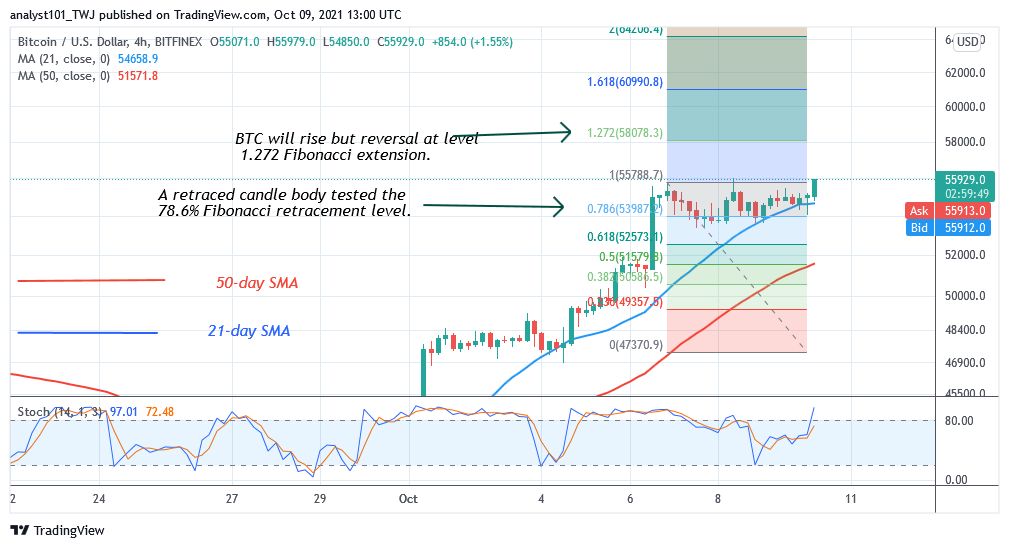
Similarly, the daily stochastic has indicated a possible upward move of the crypto but will reverse at the recent high. Meanwhile, on October 6 uptrend; a retraced candle body tested the 78.6% Fibonacci retracement level. The retracement indicates that BTC price will rise but reverse at level 1.272 Fibonacci extension or $58,078.30 high. From the price action, BTC’s price has been struggling to break the resistance at $56,000. A break above the resistance will lead to an eventual reversal.
XRP/USD Major Trend: Bullish
Ripple’s (XRP) price has broken above the moving averages but the uptrend is facing rejection of the $1.20 resistance. Buyers have retested the resistance but were repelled twice. XRP price is retracing from the recent high after the rejection. The market is expected to reach a low of $1.15 before resuming upward.
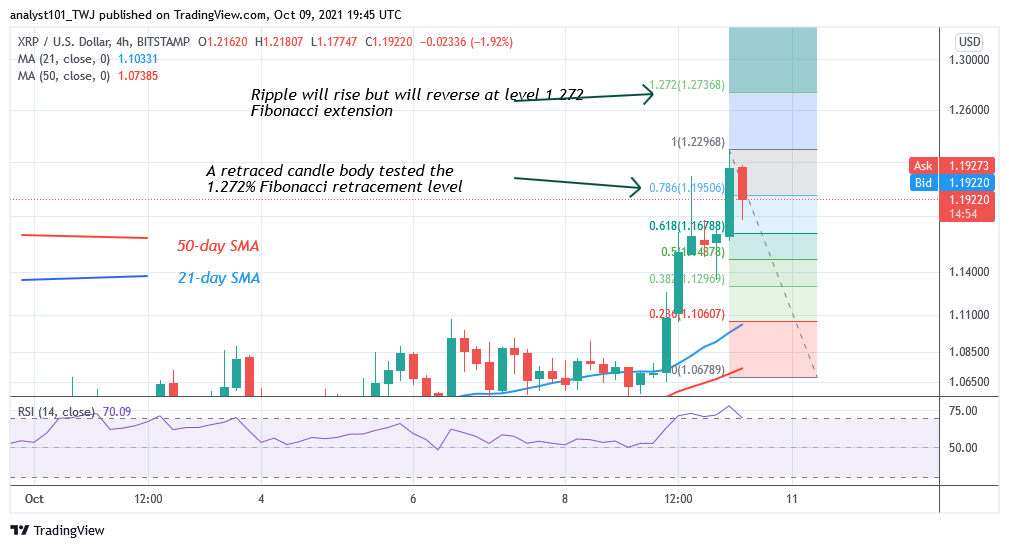
However, if price breaks below the $1.12 support, Ripple will fall and resume a downward correction. XRP/USD will rise if price breaks above the resistance at $1.20. Meanwhile, on October 10 uptrend; a retraced candle body tested the 78.6% Fibonacci retracement level. The retracement indicates that XRP price will rise but reverse at level 1.272 Fibonacci extension or level $0.27. From the price action, XRP is retracing and attempting to find support above $0.18. The market will resume upward as price finds support.
DOT/USD Major Trend: Bullish
Polkadot’s (DOT) price is trading in the bullish trend zone. The uptrend has been facing rejection at the $37 high. Today, Polkadot is retracing after reaching the $38 resistance zone.
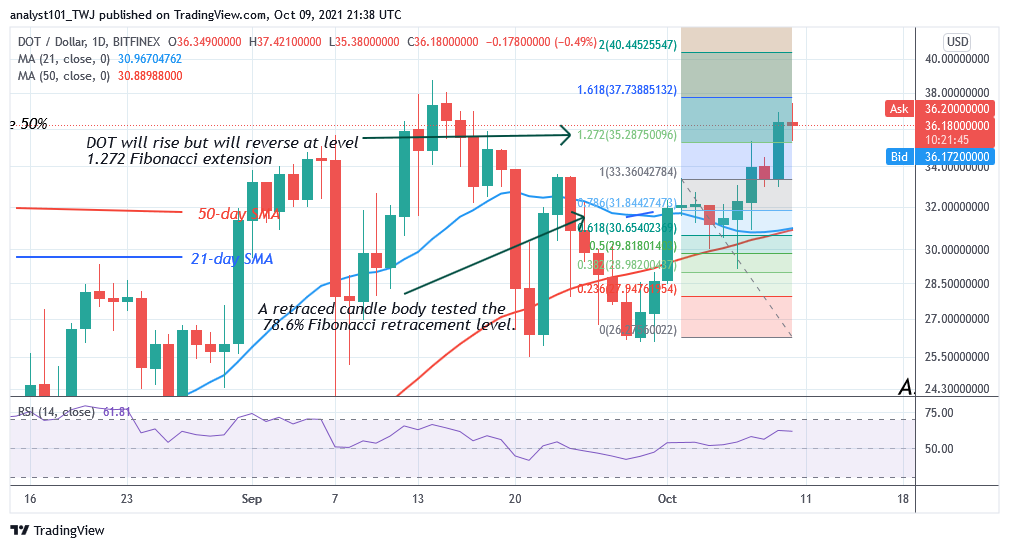
On September 14, DOT price faced similar rejection at the $38 resistance zone. Polkadot declined to the low of $26 as bulls bought the dips. Buyers have pushed the altcoin to the same resistance but were unable to sustain above the recent high. Meanwhile, on October 2 uptrend; a retraced candle body tested the 78.6% Fibonacci retracement level. The retracement indicates that DOT price will rise but reverse at level 1.272 Fibonacci extensions or $38.25.
LTC /USD Major Trend: Bullish
Litecoin’s (LTC) price is trading marginally above the moving averages. The upward move has been interrupted at the resistance of $184. Since October 6, LTC/USD has been fluctuating below the overhead resistance as bulls fail to sustain above the $184 price level.
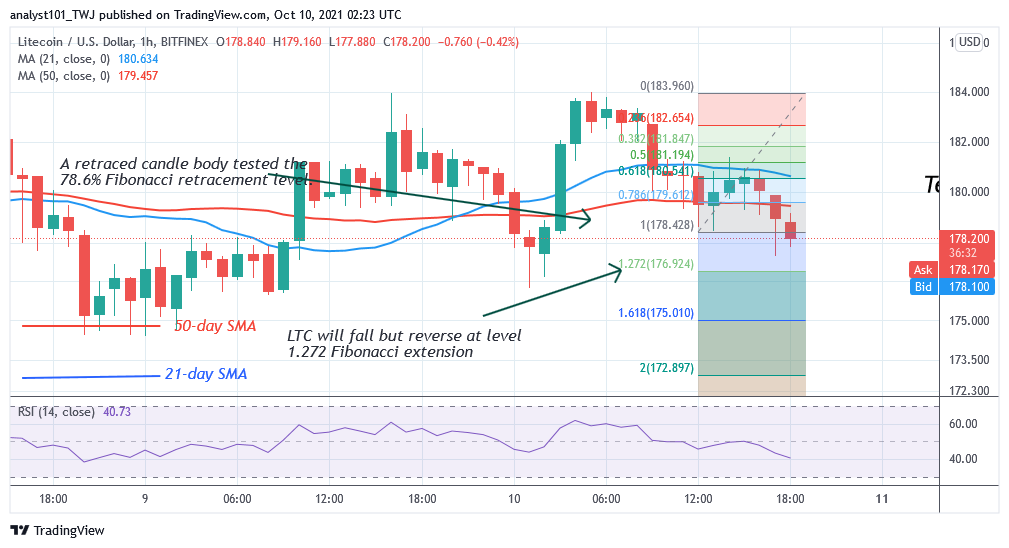
Today, the LTC price is retracing from the resistance zone. The altcoin has found support above the moving average. On the downside, if the bears break below the moving averages, the altcoin will fall and resume downward correction. Conversely, if the crypto breaks above the $184 resistance, the Fibonacci tool analysis will hold. Meanwhile, on October 10 downtrend; a retraced candle body tested the 78.6% Fibonacci retracement level. The retracement indicates that Litecoin is likely to fall but reverse at level 1.272 Fibonacci extension or level $176.92. The altcoin will resume a new uptrend after retesting the Fibonacci extension.
LINK /USD Major Trend: Ranging
Chainlink’s (LINK) price has resumed a range-bound move after the uptrend of October 2. Buyers could not sustain above the $28 resistance. For the past week, Chainlink is fluctuating between $25 and $28 price levels.
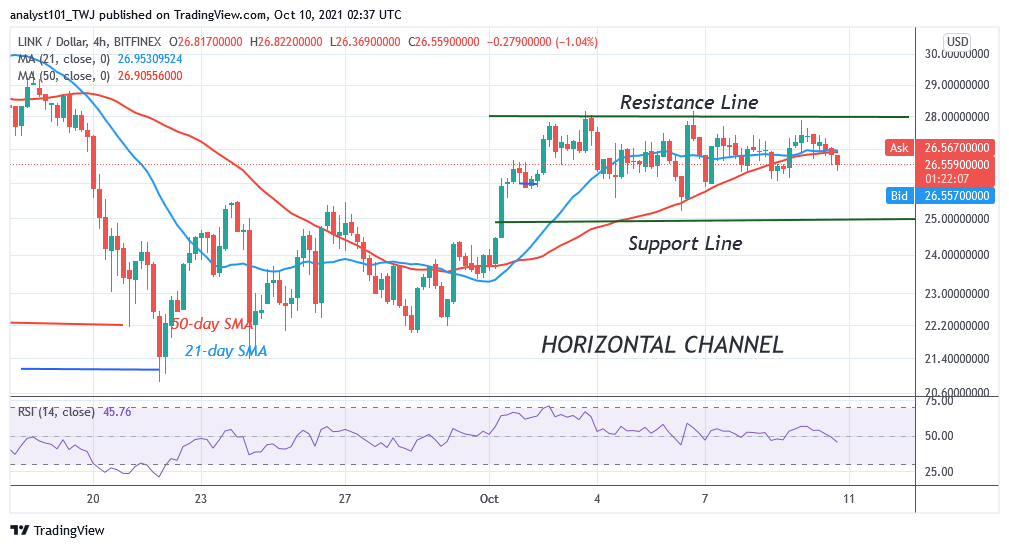
The bulls have retested the resistance level on four occasions to break above it. The bulls were repelled as the altcoin slumped to the middle of price range. Meanwhile, the altcoin price movement is marginal. The price action is characterized by small body candlesticks called Doji and Spinning tops. These candlesticks indicate that buyers and sellers are undecided about the direction of the market. The range-bound move is likely to continue for a few days.