
For the past week, Bitcoin has been struggling to sustain above the $48,800 resistance zone. Buyers made concerted efforts to revisit the $50,000 psychological price level but were repelled. This week, if buyers sustain BTC price above the 21-day SMA, the resistance at $48,800 is likely to be broken. Ripple, Litecoin, and Chainlink are in downward correction as the altcoins consolidate above the 50-day SMA. These coins may decline if the current support fails to hold. Polkadot is making positive moves in the bullish trend zone. The altcoin is expected to rise.
BTC/USD Major Trend: Bullish
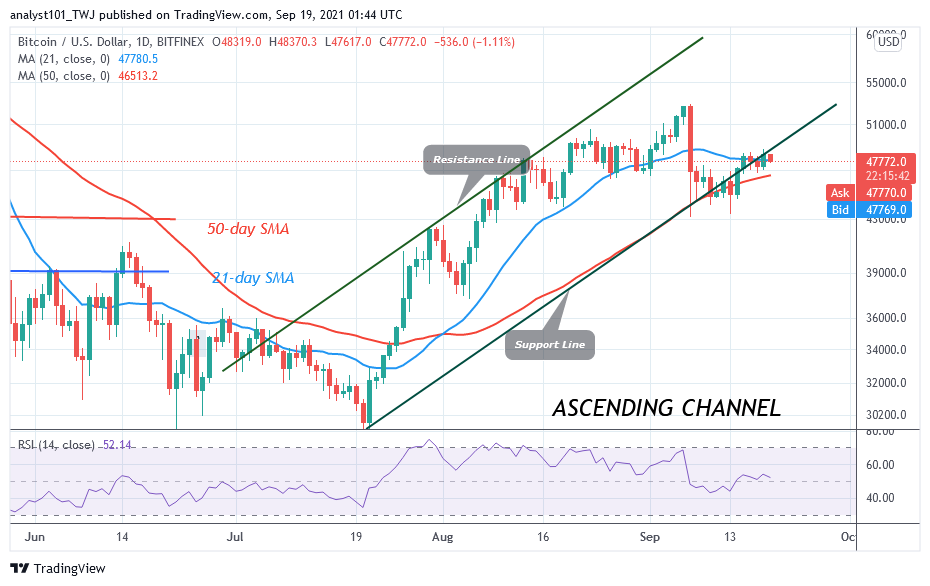
Presently, Bitcoin is in a downward move after facing rejection at the $48,800 resistance zone. On September 18, buyers pushed BTC’s price to the high of $48,816 but could not sustain the bullish momentum to the previous high. On the upside, a break above the recent high will catapult the crypto to rally above the $50,000 psychological price level. Long candlestick wicks at the resistance zone indicate that there is strong selling pressure at the recent high.
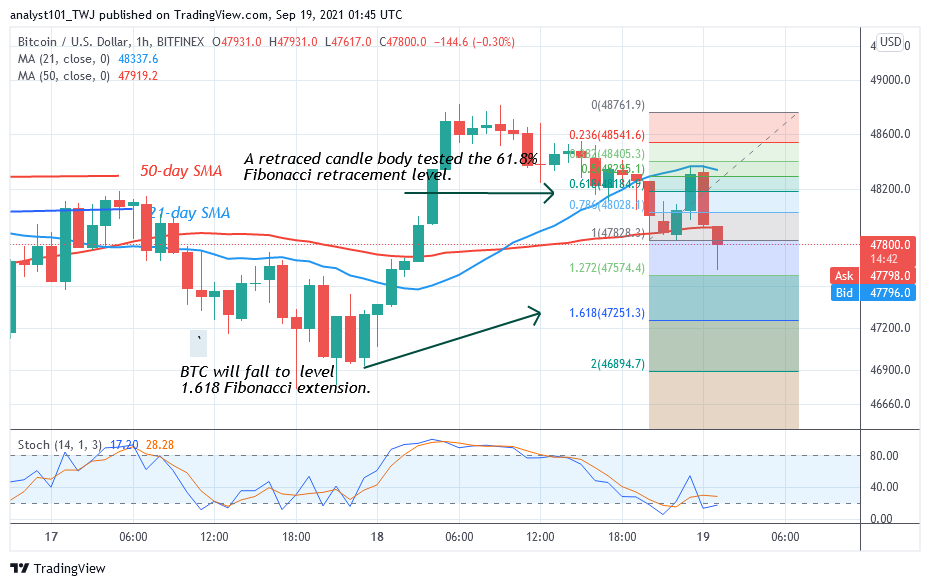
Consequently, BTC’s price has resumed a downward move. The current downward move will extend to the low of $47,200. The upward move may resume if the bulls can defend the $47,200 support. Meanwhile, on September 18 downtrend; a retraced candle body tested the 61.8% Fibonacci retracement level. The retracement indicates that BTC price will fall to level 1.618 Fibonacci extension or level $47,251.30.
XRP/USD Major Trend: Bullish
Ripple’s (XRP) price has fallen to the support above the 50-day SMA but below the 21-day SMA. Since September 7, XRP has been in a downward correction. XRP will resume an upward move if price breaks above the 21-day SMA.
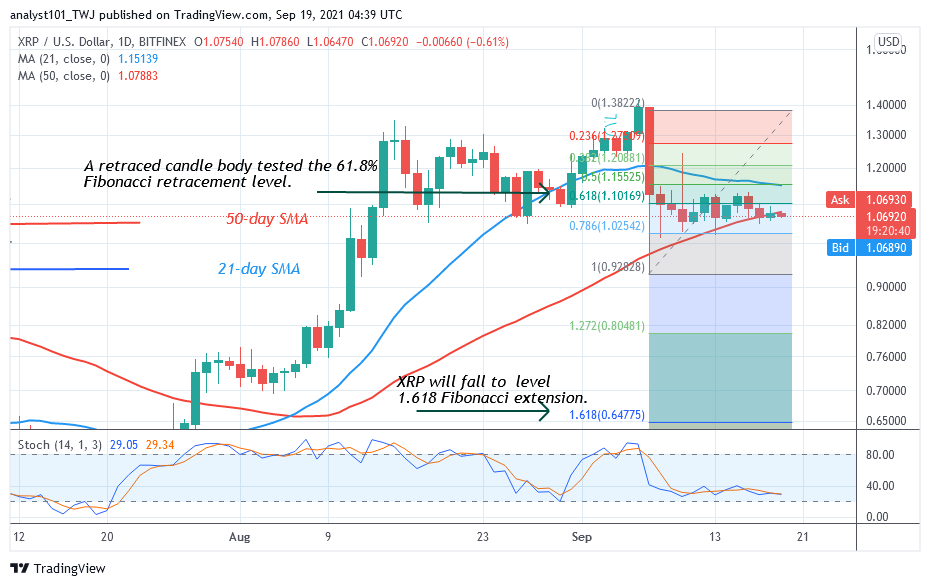
Presently, the bears are attempting to break below the 50-day SMA. If the bears are successful, the selling pressure will resume. The crypto will further decline to the lows of either $0.92 or $0.80. Meanwhile, on September 7 downtrend; a retraced candle body tested the 61.8% Fibonacci retracement level. The retracement indicates that XRP will fall to level 1.618 Fibonacci extension or level $0.64. From the price action, the bears have broken below the 50-day SMA suggesting a possible downward move. Ripple, may retest the 1.618 Fibonacci extension or level $0.64.
.
DOT/USD Major Trend: Bullish
Polkadot’s (DOT) price is falling after rejection from the $40 resistance. DOT price has fallen to the low of $34 and it is above the 21-day SMA support. On the daily chart, if price breaks below the 21-day SMA, the altcoin will further decline on the downside.
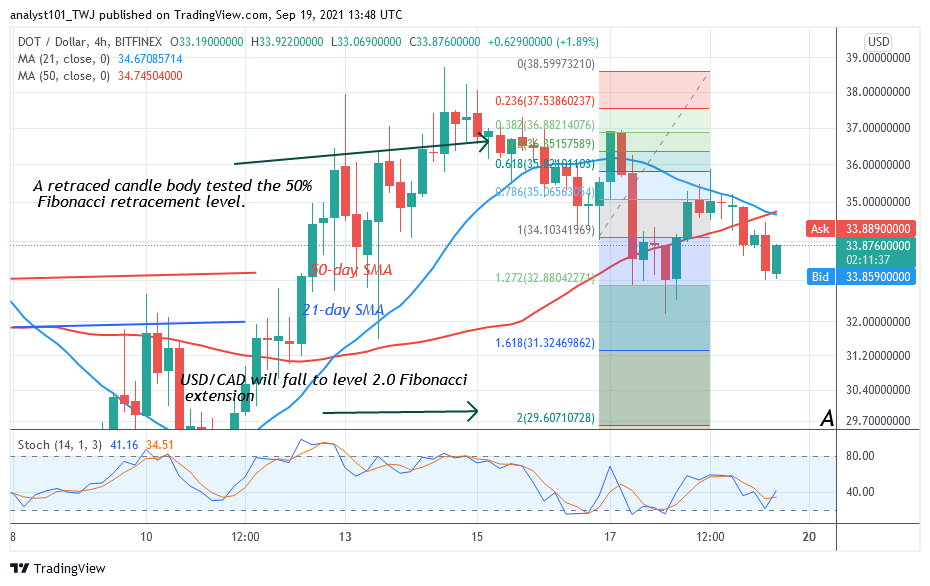
Presently, the altcoin is falling after rejection from the $35 high. Meanwhile, on September 16 downtrend; a retraced candle body tested the 50% Fibonacci retracement level. The retracement indicates that DOT will fall to level 2.0 Fibonacci extension or level $29.64. From the price action, the market has declined to the low $33.71 at the time of writing.
LTC /USD Major Trend: Bullish
Litecoin’s (LTC) price is trading above the support of the 50-day SMA but below the 21-day SMA. The altcoin has fallen to the low of $178 at the time of writing. On the downside, if the bears break below the 50-day SMA, the selling pressure will be accelerated.
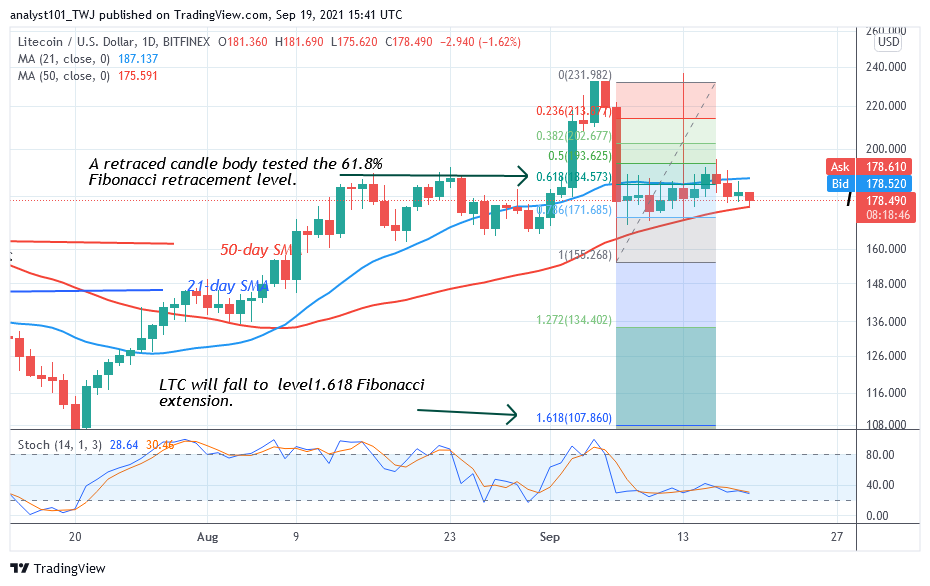
The crypto will fall to the low of $155. Further declines are likely if the $155 support cracks. Meanwhile, on September 17 downtrend; a retraced candle body tested the 61.8% Fibonacci retracement level. The retracement indicates that LTC will fall to level 1.618 Fibonacci extension or level $107.86. From the price action, LTC price is hovering above the 50-day SMA
LINK /USD Major Trend: Bullish
Since September 7, Chainlink’s price has been trading above 50-day SMA but below 21-day SMA. The altcoin has been in a range-bound move above the current support for the past two weeks.
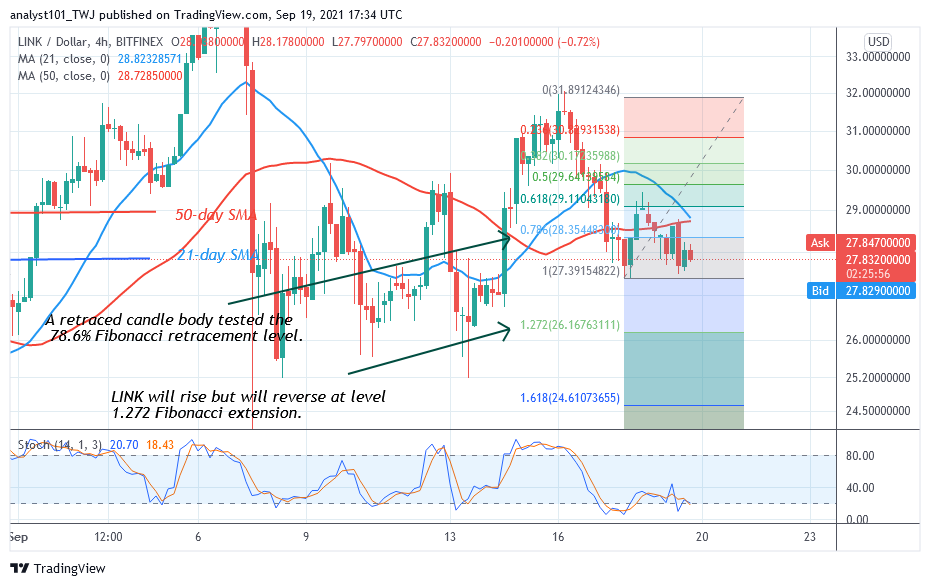
The crypto’s price will resume selling pressure if the bears break below the 50-day SMA support. Similarly, if buyers pushed the altcoin above the 21-day SMA and the bullish momentum is sustained, the uptrend will resume. Meanwhile, on September 17 downtrend, a retraced candle body tested the 78.6% Fibonacci retracement level. The retracement indicates that LINK will rise but will reverse at level 1.272 Fibonacci extension.


