
Since September 1, Bitcoin bulls have made concerted efforts to sustain above the $50,000 overhead resistance. Bitcoin has been repelled as it resumed a range-bound move below the overhead resistance. The crypto is in a downward correction as price fluctuates between $49,600 and $50,400. Ripple and other altcoins are facing similar price action.
BTC/USD Major Trend: Bullish
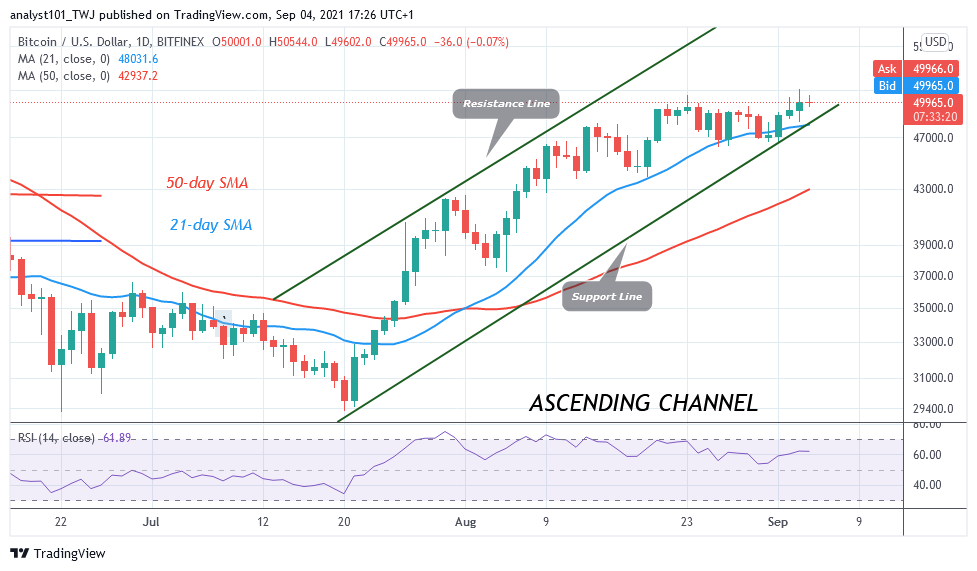
Since September 3, Bitcoin bulls have retested the $50,000 psychological price level on more than four occasions. In the first major retest, buyers pushed the crypto to the high of $51,142. The bullish momentum could not be sustained above the recent high as the crypto dropped sharply. BTC price fell to the low of $49,584 as bulls bought the dips. Today, the crypto was resisted at the high of $50,544 as price corrected upward. If buyers sustain the price above $50,000, and the bullish momentum is sustained the market will rise to $51,000 and the bullish momentum will extend to the highs of $55,000 and $60,000. However, after the second rejection, the BTC price is falling to revisit the previous low at $49,600.
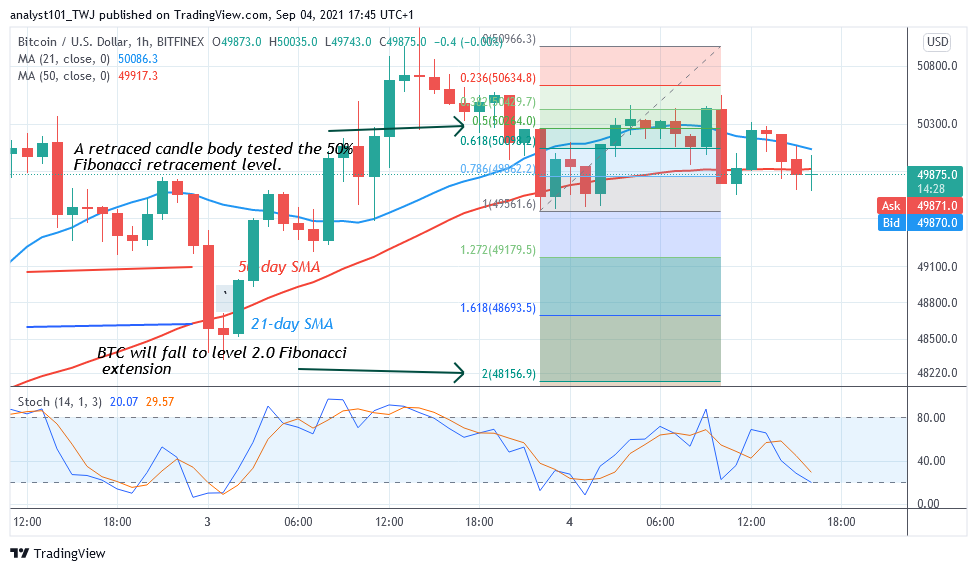
Bitcoin will continue to fall on the downside if price breaks the support at $49,600. The market will further decline to the low of $48,200. The uptrend will resume if the support at $49,600 holds. Meanwhile, on September 3 downtrend; a retraced candle body tested the 50% Fibonacci retracement level. The retracement indicates that BTC will fall to level 2.0 Fibonacci extension or level $48,156.90.
XRP/USD Major Trend: Bullish
Following its attainment of $1.34 on August 16, Ripple has been in a range-bound movement. XRP price fluctuates between $1.05 and $1.30. Buyers have not been able to sustain the bullish momentum above the $1.34 overhead resistance.
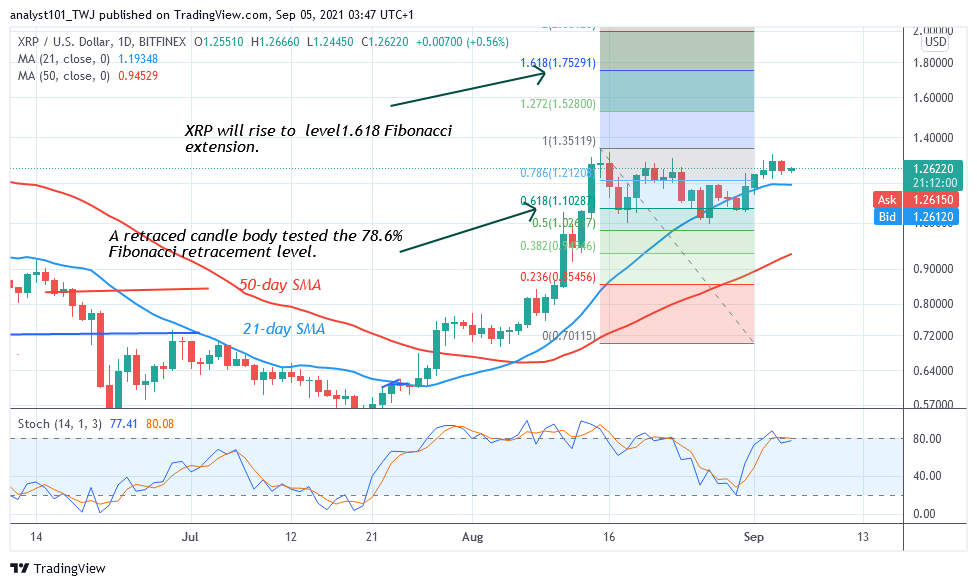
If buyers break the $1.34 resistance, the market will rally to $1.80 high. The downtrend will resume if price falls and breaks the support at $1.05. XRP will decline to $0.83 low. Meanwhile, on August 15 uptrend; a retraced candle body tested the 61.8% Fibonacci retracement level. The retracement indicates that Ripple is likely to rise to level 1.618 Fibonacci extension or level $1.75. From the price action, the XRP price is struggling to break above the $1.34 resistance level.
DOT/USD Major Trend: Bullish
On September 1, Polkadot (DOT) has to retest the $34 resistance zone but could not sustain above it. Today, the DOT price is falling after retesting the overhead resistance level. DOT price is falling because the market has been in an overbought condition for the past five days.
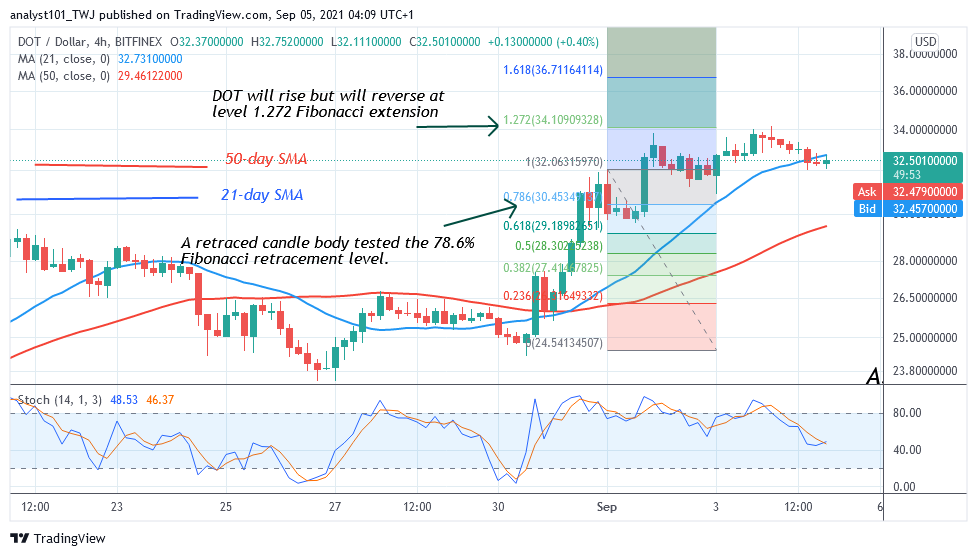
Further upward movement of the DOT is unlikely as sellers emerge in the overbought region. Meanwhile, on September 1 uptrend; a retraced candle body tested the 78.6% Fibonacci retracement level. The retracement indicates that the DOT price will rise but reverse to1.272 Fibonacci extension or level $34.10. From the price action, Polkadot is reversing after attaining the high of $34. The market is likely to decline to the low of $30.
LTC /USD Major Trend: Bullish
On September 4, buyers pushed Litecoin (LTC) to the high of $223.21. After the altcoin attained that high, the market resumed a downward move. LTC price declined and found support above the $208 support level.
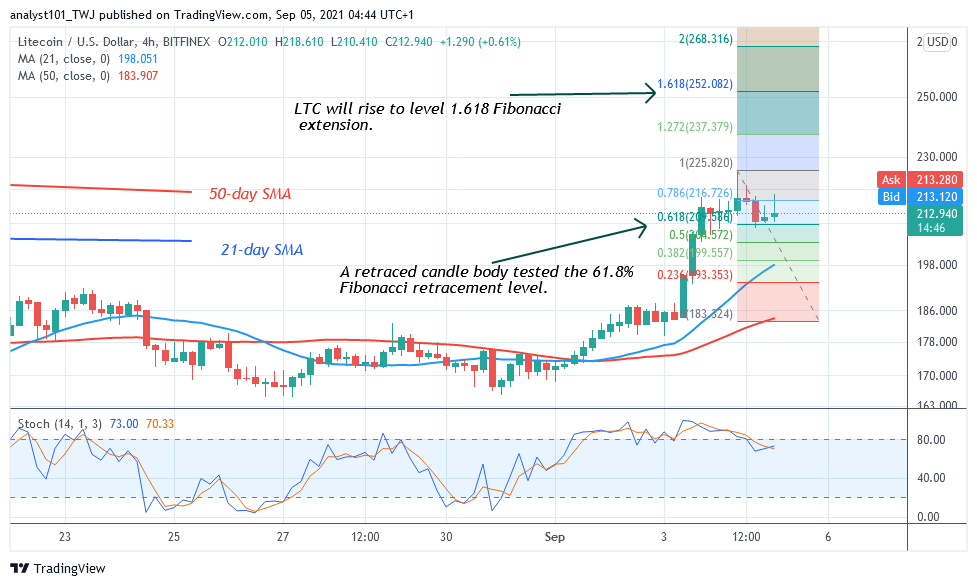
Buyers are attempting to push the altcoin above the recent high. A break above the recent will push the altcoin to a new high of 250. Otherwise, if the bears break the $208 support, the market will decline to the low of $186. Meanwhile, on the September 4 uptrend, a retraced candle body tested the 61.8% Fibonacci retracement level. The retracement indicates that LTC will rise to level 1.618 Fibonacci extension or level $252.08.
LINK /USD Major Trend: Bullish
For the past 48 hours, Chainlink’s (LINK) price has been in a downward move. The altcoin rallied to $31.50 on September 3. LINK/USD is falling because of the overbought condition of the market. The altcoin is likely to fall to the low of $29.17.
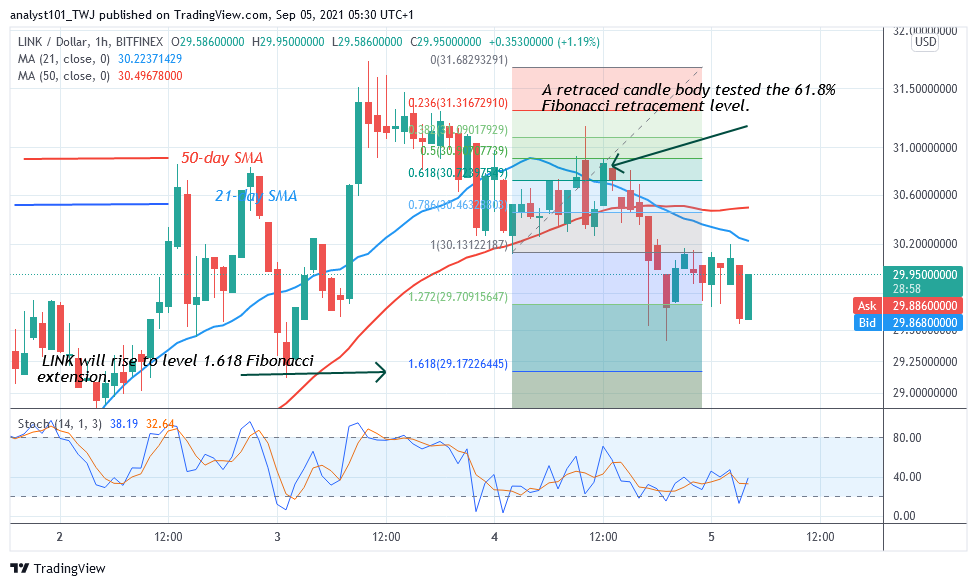
The uptrend will resume if prices retrace and find support above $29. As the market resumes upward, buyers are likely to retest and break the resistance at $31.50. The altcoin’s first target price is at level $35. The bullish momentum is likely to continue on the upside. However, if the altcoin faces rejection at the recent high, Chainlink will fall and find support above the current support. Meanwhile, on the September 4 downtrend, a retraced candle body tested the 61.8% Fibonacci retracement level. The retracement indicates that LINK will fall to level 1.618 Fibonacci extension or level $29.17.


