
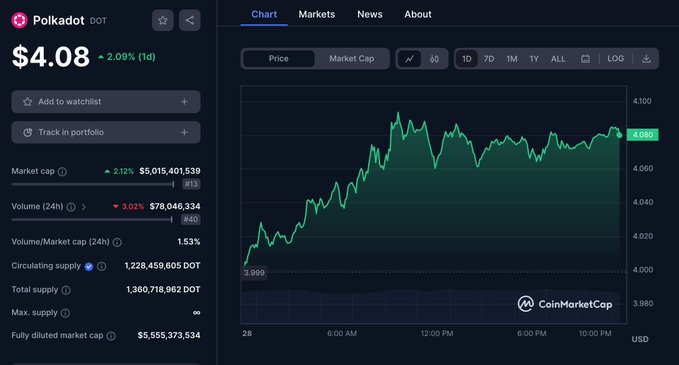
 Polkadot (DOT) has seen a marginal 0.54% price decline in the last 24 hours, settling at $4.04. While this daily setback is modest, a closer look at Polkadot’s price action and market data unveils important insights into its potential path forward.
Despite the dip, Polkadot maintains its position as the 11th largest cryptocurrency, boasting a market capitalization of $4.97 billion. With $91.59 million in 24-hour trading volume, there’s evident interest and activity among traders and investors. However, it’s worth noting that this 24-hour trading volume is slightly lower than the 30-day average of around $130 million.
Analyzing percentage changes over various timeframes adds depth to the picture. A slight 0.13% hourly increase hints at a possible sentiment shift and emerging support following the daily decline. Over the past week, DOT exhibited a 0.35% decrease, suggesting a rangebound pattern with limited upward momentum.
Less optimally, the monthly and 6-month percentage changes show more substantial losses. A 9.38% monthly decline indicates sustained downward pressure, while a 33.37% 6-month loss signifies a prolonged downtrend since April, reflecting broader crypto market trends.
Despite these challenges, Polkadot’s fundamentals and developer activity signal long-term potential.
Looking ahead, Polkadot faces near-term hurdles, especially the struggle to breach the key 200-day moving average around $7. A breakthrough above this resistance line would signal a bullish trend change, aiming for a recovery toward the 2022 high near $55. Failure to surpass this moving average could result in further declines, possibly to the 2018 bear market bottom around $2.50.


