
 For the past week, the cryptos bullish gains were erased as the coins faced strong rejection at the recent highs. There are indications that the coins will face further depreciation if the critical support levels are breached. Besides, the altcoins have fallen to the bearish trend zones as selling pressure is unavoidable. However, Ripple shows impressive moves as the coin reaches the bullish trend zone.
BTC/USD Major Trend: Bearish
Today, Bitcoin has resumed a fresh uptrend as it reached a new high above $10,700. Since September 16, BTC price has been rising and retesting the $11,000 resistance. Buyers have failed to push prices above the resistance level.
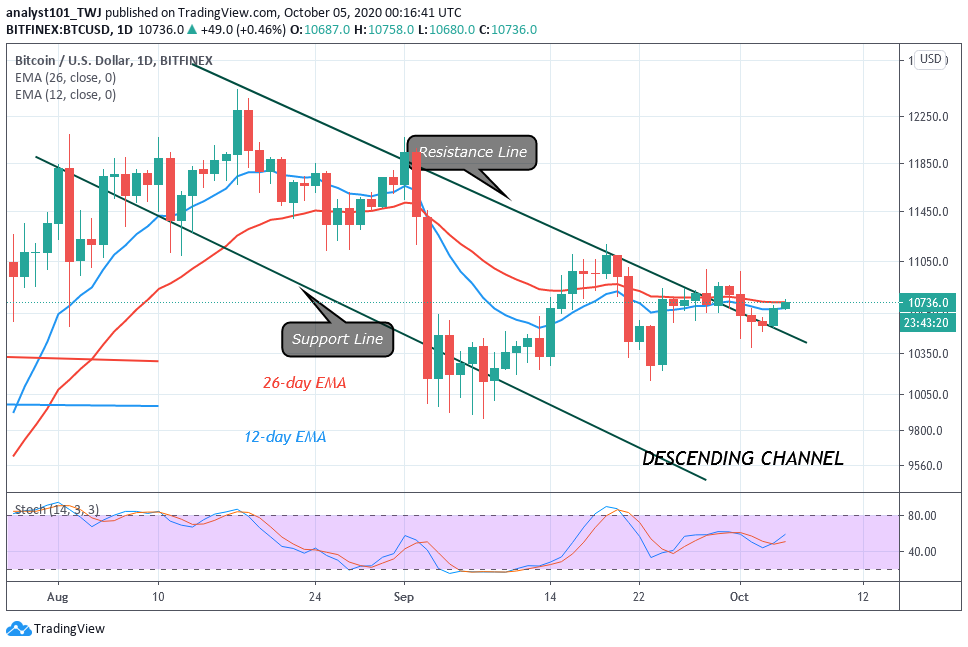
Consequentially, the king coin slumped to $10, 391 low, and resumed upward. This has been the market scenario for the past three weeks. Eventually, if price breaks the resistance at $11,000, BTC will have an accelerated price movement. Once price breaks the $11,000 to $11,300 resistance, the market will reach a high of $11,800. The price movement will continue to retest the $12,000 and $12,400 overhead resistance.
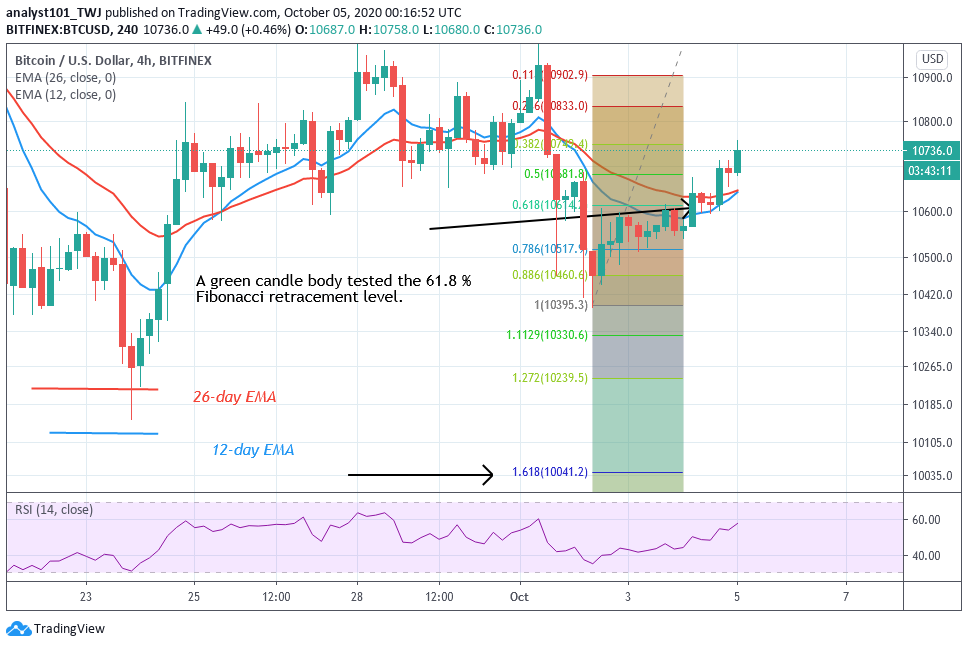
Conversely, if buyers fail to break the resistance, there will be a bearish reaction. The coin will fall to the previous lows. From the price action, a retraced candle body has retested the 61.8 % Fibonacci retracement level. This implies that if Bitcoin falls it will reach the 1.618 Fibonacci extensions or the low of $10,041.20.
ETH/USD Major Trend: Bearish
Following the last bearish impulse on October 2, Ether fell to the low at $335 and rebounded. The rebound has taken price above $350 support. This is a positive move, if the momentum is sustained, the market will rise and retest the $390 resistance level. However, if the current momentum is interrupted and price breaks below the $350 support, the downtrend will resume.
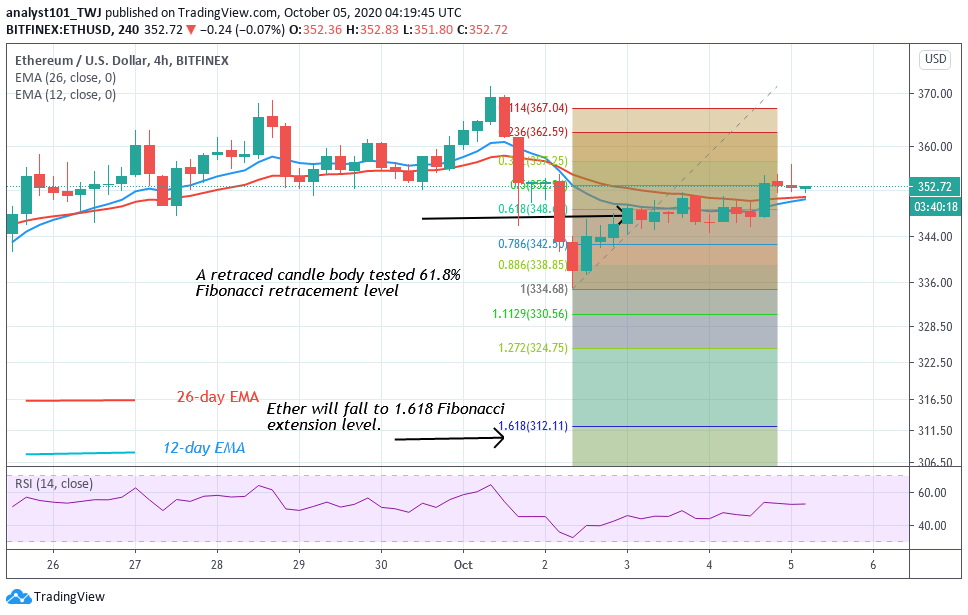
Meanwhile, On October 2 downtrend, the last retraced green candle body tested the 61.8% Fibonacci retracement level. This suggests that the biggest altcoin will further depreciate to the 1.618 Fibonacci extension low or a low at $312.11. This is on the ground that buyers fail to sustain uptrend above $350.
XRP /USD Major Trend: Bullish
Following its eventful rebound above $0.22 low, XRP rose above the $0.24 support. However, the bulls could not continue with the recent rally as the price continues to fluctuate above the $0.24 support. On October 1, the bears overpowered the bulls as the coin dropped sharply to $0.2290 low.
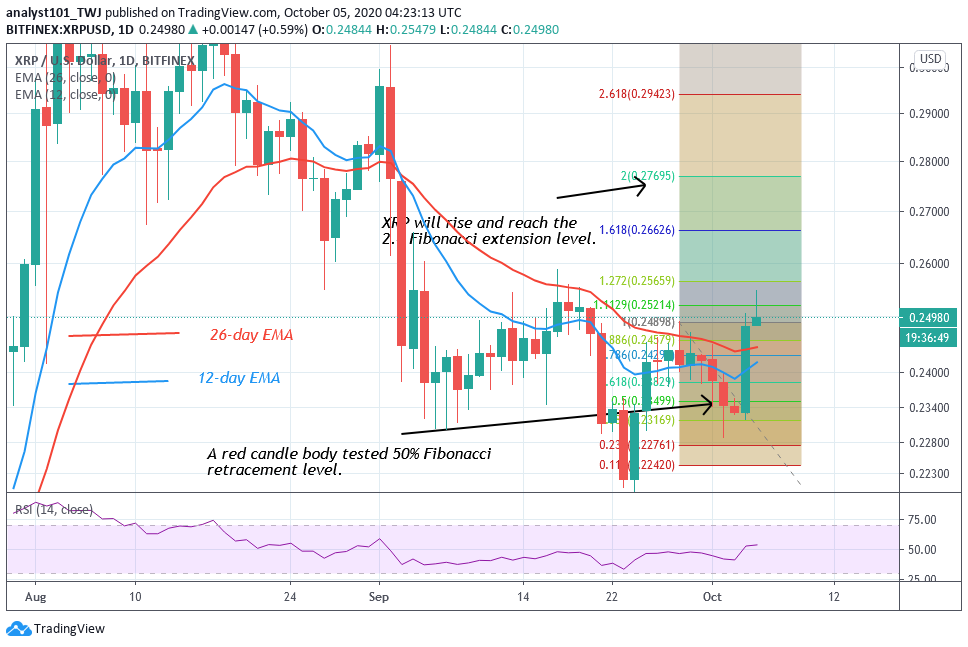
Nonetheless, on October 4, XRP recovered as it rebounded and broke through the resistance of the descending channel. Ripple has also broken above the EMAs. It is likely the upward move has begun as price rally above $0.25 high. Nevertheless, on the September 26 uptrend, the coin reached the $0.24 high. The retraced red candle body tested the 50% Fibonacci retracement level. This implies that the coin will rise to 2.0 Fibonacci retracement level. That is a high of $0.276.
BCH /USD Major Trend: Bearish
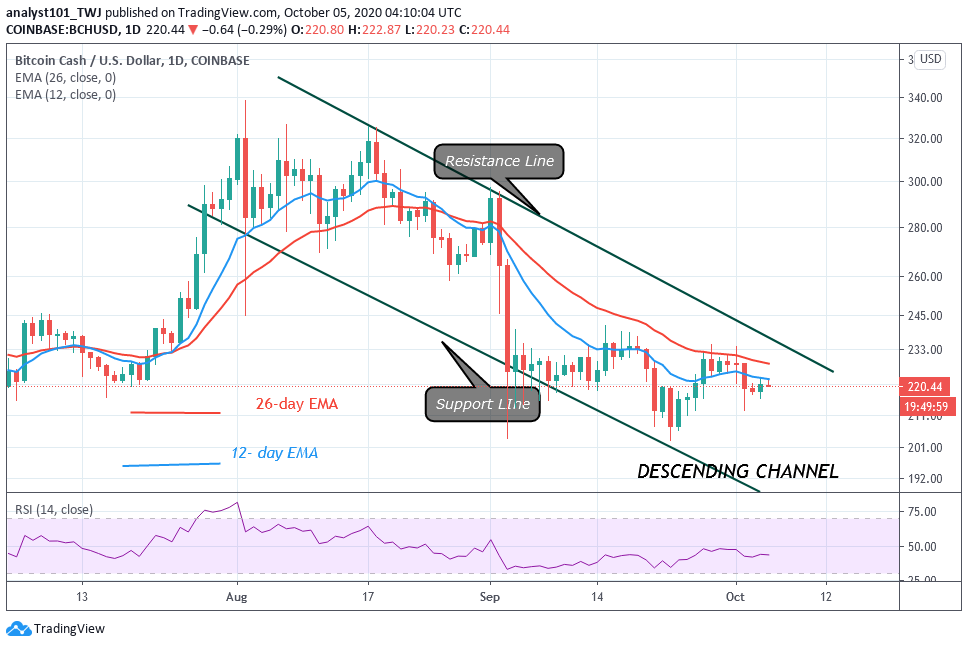
Bitcoin Cash is trading at $220 at the time of writing. The price is correcting upward after falling to a low of $212. Before now buyers have been struggling to push price above $231 resistance. After two unsuccessful attempts at the resistance, the coin was repelled as it reached a low of $212. The bulls are attempting to break above the EMAs. A break above the EMAs will facilitate the upward movement of the coin. Nonetheless, if price breaks above $234, the bullish trend will resume. BCH is at level 43 of the Relative Strength Index period 14. It indicates that the coin is in the downtrend zone and below the centerline.


