
In the previous week, Bitcoin and the three altcoins were making impressive moves as the cryptos rallied to their respective highs. On November 26, the cryptos had a general breakdown as bulls bought the dips to resume a fresh uptrend. The coins are likely to break above the recent highs. For example, if BTC breaks above $19,740, the coin is expected to rally above $22,000.
BTC/USD Major Trend: Bullish
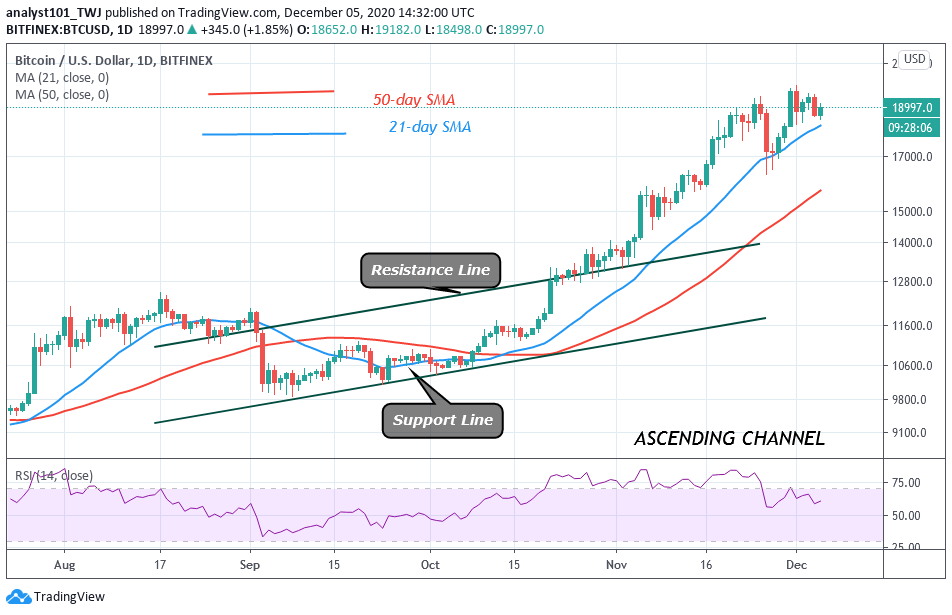
For the past week, Bitcoin bulls push BTC to a high of $19,400 on November 24 but could not sustain the upward move. There was a bearish reaction as the crypto plunged to $16,400 low. The bulls buy the dips as the crypto resumes a fresh uptrend. In the second uptrend, BTC rallied to $19,740 high but pulled back. Since December 1, Bitcoin has been fluctuating below the $19,740 overhead resistance. As price fluctuates near the resistance zone, there is the possibility of a breakout at the recent high. A breakout at $19,740 will propel the price to rally above $22,000. Subsequently, the bullish momentum will continue on the upside. However, if a breakout fails to occur at the $19,740 resistance; the market will continue to be range-bound below the overhead resistance.
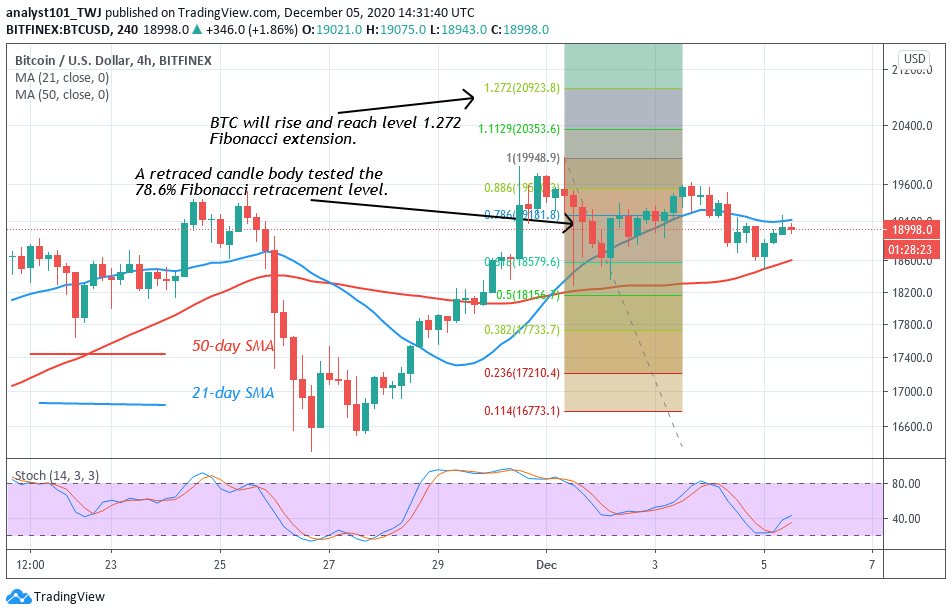
Meanwhile, the Fibonacci tool has indicated an upward movement of Bitcoin. On December 1 downtrend; the retraced candle body tested the 78.6% Fibonacci retracement level. This implies that Bitcoin will rise to level 1.272 Fibonacci extension and reverse. That is the king coin will reach the high of $20,923.80 and reverse to the 78.6% Fibonacci retracement level where it originated.
ETH/USD Major Trend: Bullish
On November 28, Ether was in a price rally after a disappointing breakdown. The biggest altcoin rallied to $620 to retest the overhead resistance. The bulls have earlier been resisted on November 24 as they failed to break the overhead resistance. On the upside, Ethereum will resume a fresh uptrend if the overhead resistance is breached. The coin will resume the upside momentum and rally to $800.
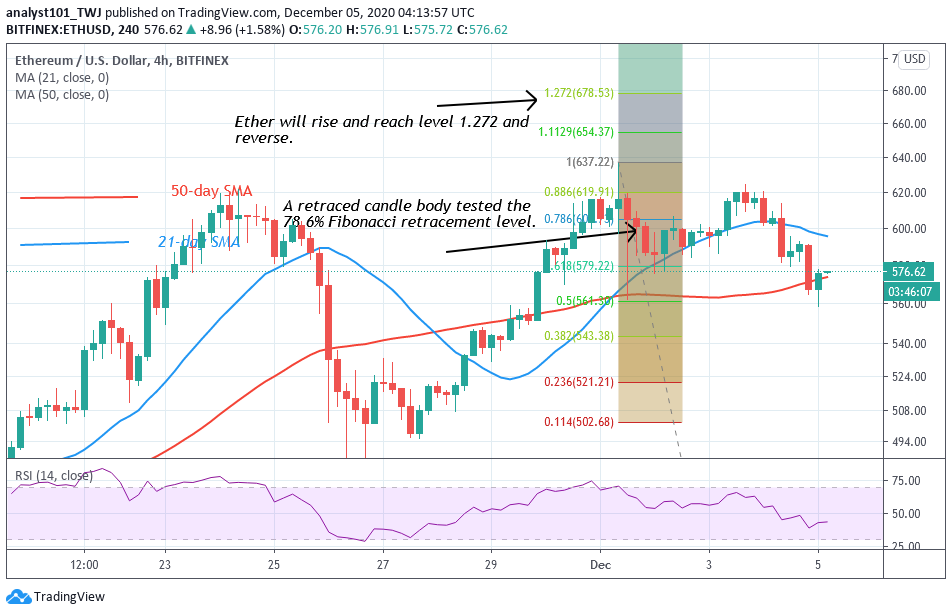
However, where buyers fail to breach the resistance, the sideways move below the recent high will continue. Nonetheless, the upside momentum will be weakened, if the coin falls and breaks below the $550 support. Meanwhile, on December 1, the Fibonacci tool has indicated an upward movement of the coin. On December 1 downtrend; the retraced candle body tested the 78.6% Fibonacci retracement level. This implies that Ethereum will rise to level 1.272 Fibonacci extension and reverse. That is the altcoin will reach the high of $678.53 and reverse to the 78.6% Fibonacci retracement level where it originated.
XRP /USD Major Trend: Bullish
For the past week, Ripple has been correcting after the recent breakdown. In the recent uptrend, Ripple rallied to the high of $0.75 on November 24. The candlestick on that date has a long wick which indicated that there is a strong selling price at a higher price level. On November 26, XRP plunged to $0.45 and corrected upward.
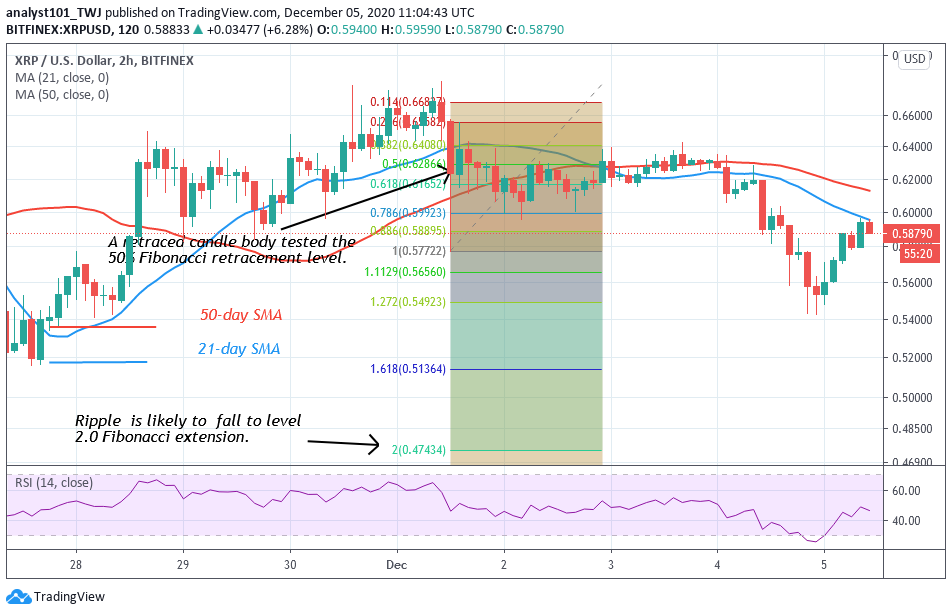
The bulls buy the dips but could not retest the overhead resistance at the $0.75 high. The coin was repelled at $0.65 resistance. The crypto has resumed a sideways move between $0.48 and $0.65. Ripple is trading at $0.58 at the time of writing. The coin risks a further downward move if it breaks below the $0.48 low. The Fibonacci tool has indicated a further downward movement of the coin. On December 1 downtrend, a retraced candle body tested the 50% Fibonacci retracement level. The retracement indicated that the coin will further depreciate to level 2.0 Fibonacci extension. That is a low of $0.47.
BCH /USD Major Trend: Bullish
Today, Bitcoin Cash has fallen above critical support at $280. This is the support level for the resumption of upside momentum. For the past week, BCH has rallied to $360 high but could not continue with the upward move. Consequently, the coin has a bearish reaction as it plunged to $251 low. The upward move has been impeded as the coin faced rejection at the $320 resistance.
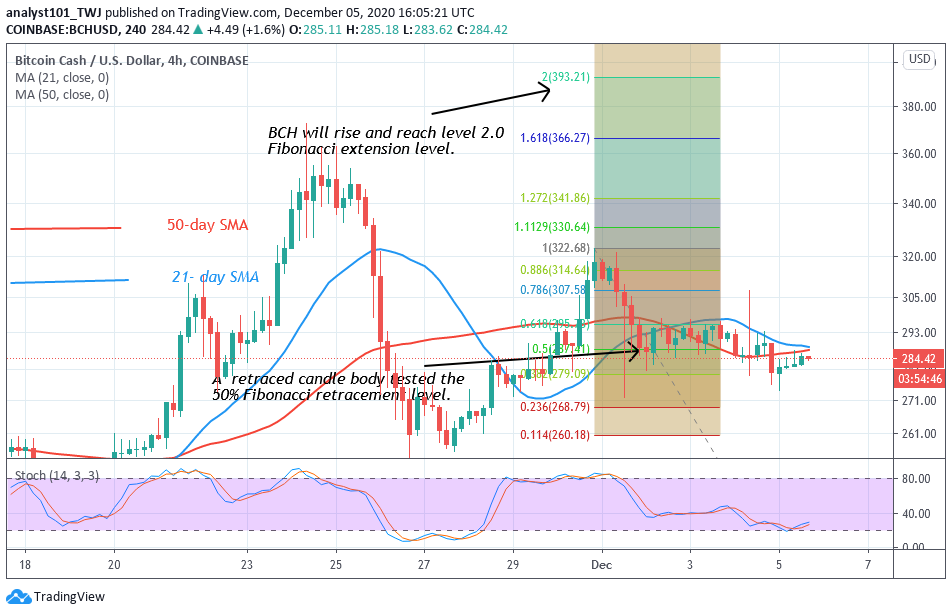
In the meantime, BCH is consolidating in a tight range between $276 and $300. As price consolidates in a tight range, there are chances of a breakout or a breakdown. In the meantime, the Fibonacci tool has indicated an upward movement of the coin. On November 30 uptrend; the last retraced candle tested the 50% Fibonacci retracement level. This retracement indicates that the coin will rise to level 2.0 Fibonacci extension or the high of $393.21.


