

For the past week, Bitcoin bulls failed to breach the $19,740 to $20,000 resistance zones. Rather, the crypto slumped to as low as $17,600. Fundamental factors are affecting BTC price. The U.S. dollar has recovered from its recent downward move. As the U.S dollar rises, Gold and Bitcoin will fall. The altcoins are falling along with the BTC price. This week the cryptos will rise after finding support to their respective lows.
BTC/USD Major Trend: Bullish
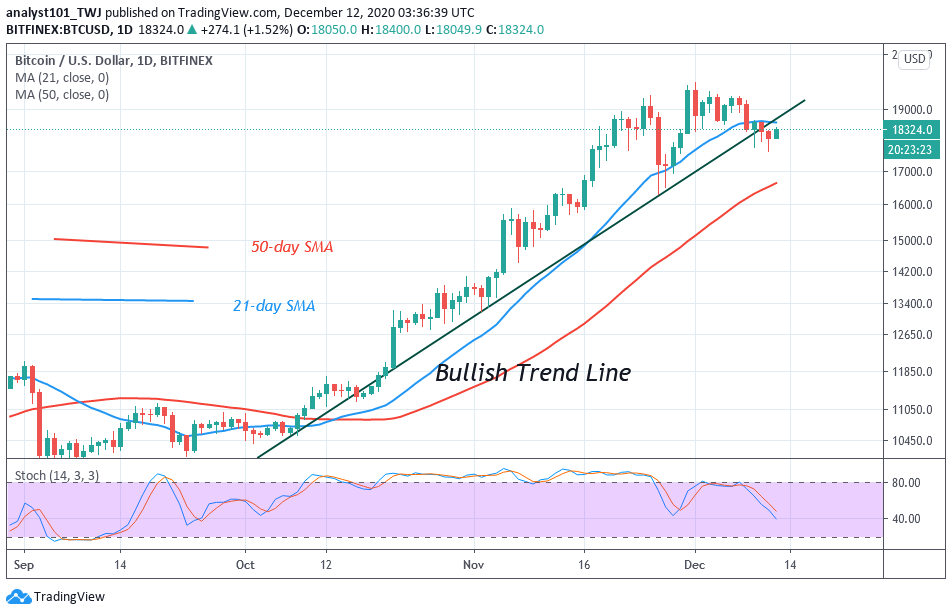
In the previous week, Bitcoin was still battling to sustain above the $19,600 resistance zone. The coin encountered another rejection at $19,400 on December 8 as BTC plunged to $17,742. Immediately; the bulls buy the dips as the price corrected upward. The correction was terminated at $18,600. Nonetheless, the bulls made three moves to break the current resistance at $18,600 but were repelled. After three days of unsuccessful attempts, the king coin further declined to $17,690 on December 11. In the last 24 hours, Bitcoin has been struggling to sustain above the $18,000 price level. The bulls have succeeded as the coin is trading at $18,336 at the time of writing. BTC is at level 49 of the Relative Strength Index period 14. It indicates that there is a balance between supply and demand.
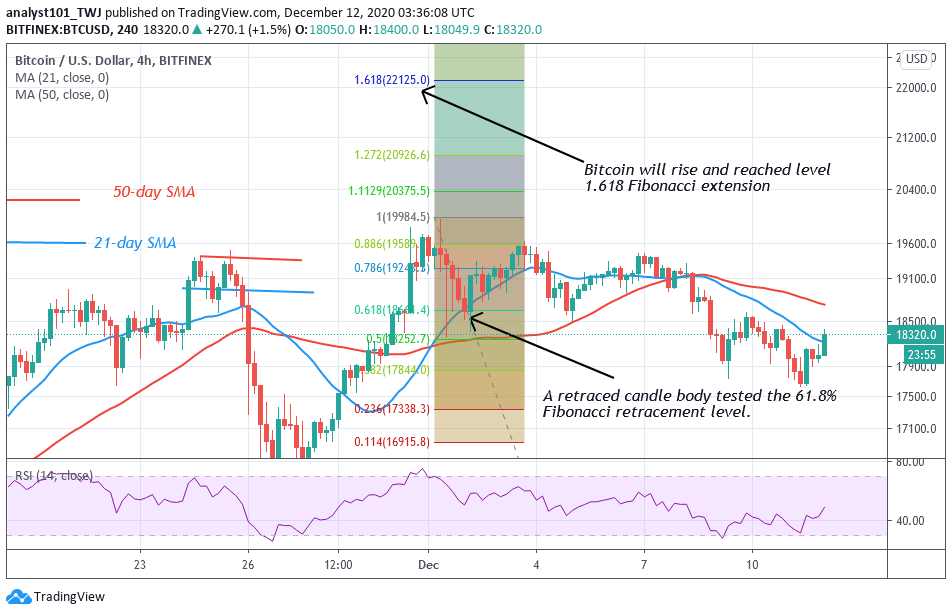
Meanwhile, Fibonacci tool has indicated a further upward movement of the coin. On December 1 uptrend; BTC was resisted at $19,556. However, the retraced candle body tested the 61.8% Fibonacci retracement level. This retracement indicates that Bitcoin will rise to level 1.618 Fibonacci extensions or the high of $22,125.0.
ETH/USD Major Trend: Bullish
Following the thrice rejection at the $620 overhead resistance, Ether fell to $565 low on December 4 and corrected upward. Buyers were stopped at the $600 high as they were repelled. The biggest altcoin fell to $540 low on December 9. For the past three days, the crypto is fluctuating between $540 and $580. One positive move buyers have made is that they have managed to sustain the price level above $560 high. In the previous price action, the upside momentum resumes when the price is sustained above $560 high.
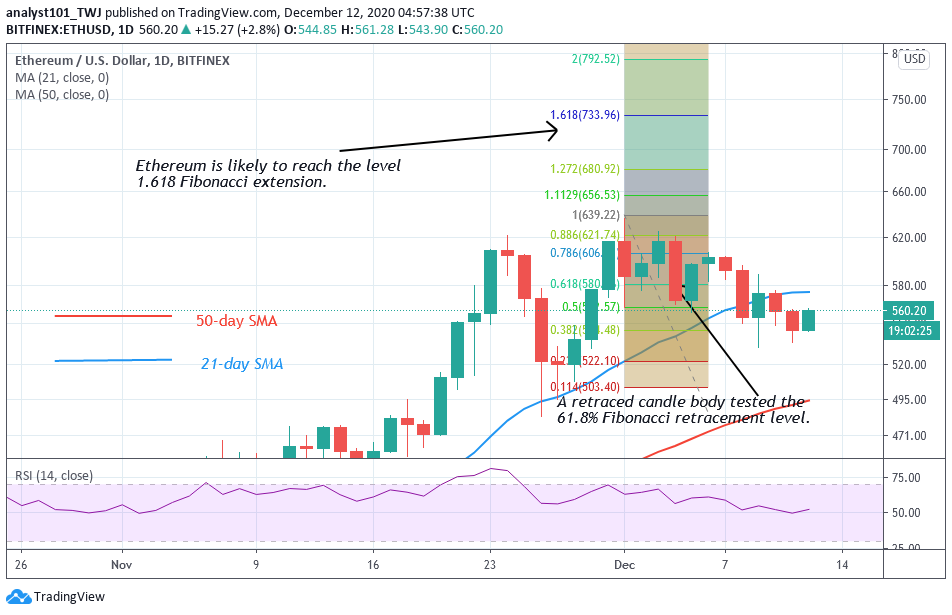
Ether is trading at $558 at the time of writing. Meanwhile, the Fibonacci tool has indicated an upward move of Ethereum. On November 30 uptrend; a retraced candle body tested the 61.8% Fibonacci retracement level. This gives the impression that Ether will rise to level 1.618 Fibonacci extensions or the high of $733.96.
XRP /USD Major Trend: Bullish
Last week, Ripple fell to a $0.54 low on December 4. The crypto’s price is making a series of lower highs and lower lows pattern. Before now the altcoin has rallied to $0.75 high but could not sustain the uptrend. In the first uptrend, XRP had a breakdown as the coin slumped to $0.49 low. The bulls buy the dips as XRP corrected upward to the $0.67 high.
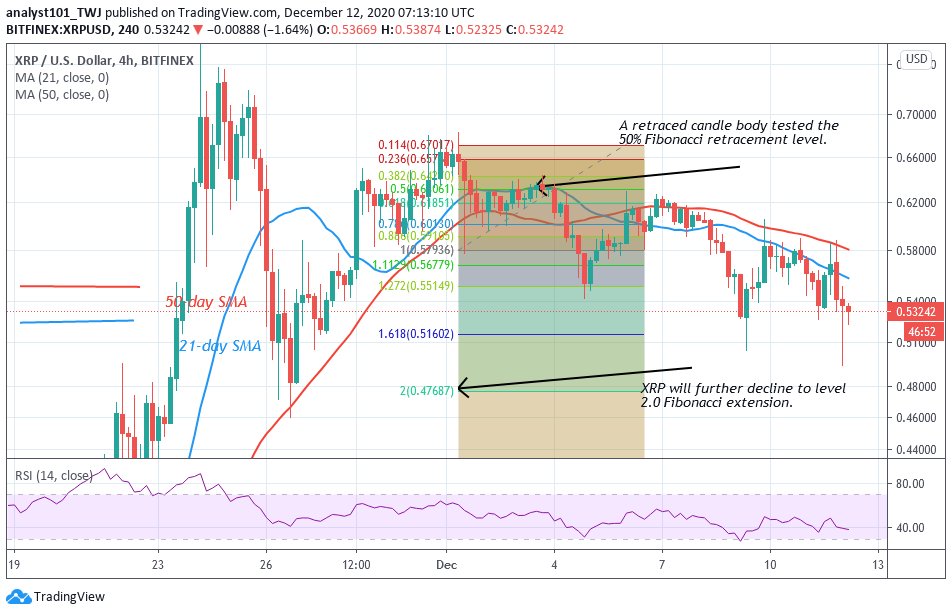
However, the selling pressure persisted as the coin resumed a downward move. There is a possibility of further downsides. The Fibonacci tool has indicated a further downward movement of the coin. On December 1 downtrend, a retraced candle body tested the 50% Fibonacci retracement level. This retracement indicates that XRP will decline to level 2.0 Fibonacci extensions or the low of $0.476.
BCH /USD Major Trend: Bearish
Bitcoin Cash has fallen into the bearish trend zone after facing rejection at $360 and $320 resistance zones. In the first uptrend, the bulls were resisted at $360 resistance as the coin fell to $251 low. The bulls buy the dips and resume the second uptrend but could not retest the overhead resistance. BCH was repelled at the $320 resistance. Today the coin has fallen to the critical support above $250. This week if the support at $250 cracks, the downtrend will resume.
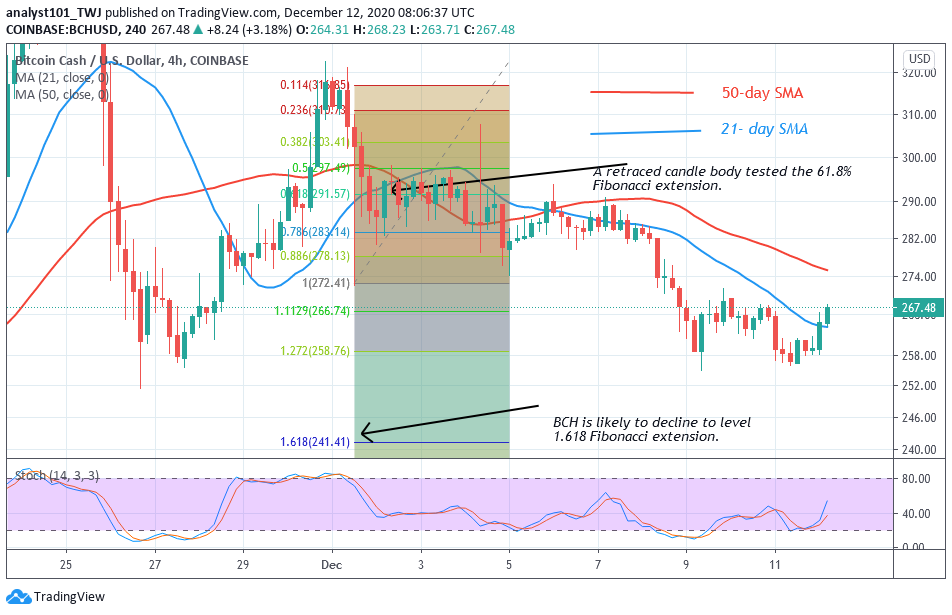
The market will revisit the previous low at $240. Meanwhile, the price action is indicating a bullish signal indicating an upward move of the coin. Presently, the coin is above the 25% range of the daily stochastic. It indicates that BCH is in a bullish momentum. Nevertheless, on December 1 downtrend, a retraced candle body tested the 61.8% Fibonacci retracement level. This retracement indicates that BCH will decline to level 1.618 Fibonacci extensions or the low of $241.41.


