

As of today, Bitcoin has made history by breaking above the psychological price level of $20,000. To be precise, the king coin has rallied above $23,000 at the time of writing. Analysts believe that the coin is expected to reach a high of $25,000. The biggest altcoin is not left out as the crypto attempts to retest the $838 historical price level of April 2018. Ripple and Bitcoin Cash are expected to break their resistance levels and resume the upside momentum.
BTC/USD Major Trend: Bullish
Last week, Bitcoin price was consolidating above the $19,000 support for about four days before the resumption of the upside momentum. The bulls have earlier failed to break the $19,500 resistance. However, on December 16, buyers broke the resistance level as the market continues the upward move. The rallies continued as price broke the minor resistance levels at $19,600 and $9,740 before breaking the $20,000 high.
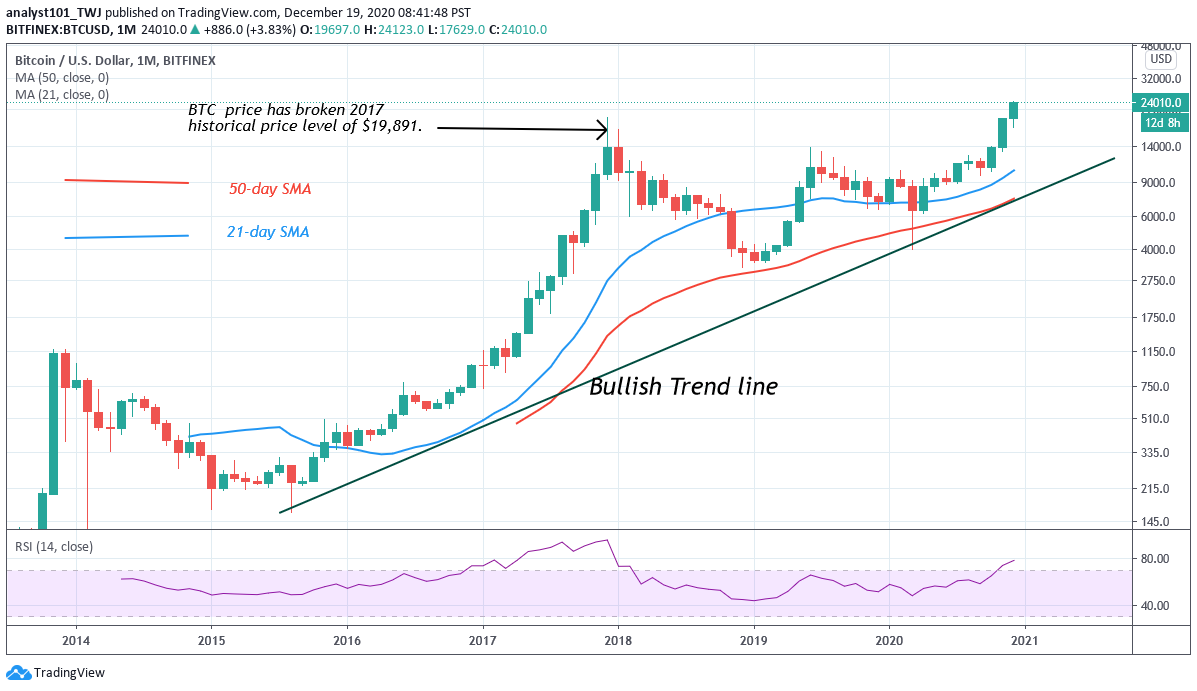
Today, BTC has rallied above the $23,000 price level. Analysts believe that the upside momentum will continue because the target price level has been crossed. The target price level has been indicated on the chart. Meanwhile, on November 24 uptrend; Bitcoin was resisted at $20,000 high. The retraced candle body tested the 61.8 % Fibonacci retracement level. This gives the impression that BTC will rise and reach level 1.618 or the high of $22,732.80.
This week a further upward move is likely as BTC targets the $25,000 price level. Bitcoin is currently trading above $23,000 at the time of writing. It is most likely the market will reach a high of $28,000 by the end of December 31, 2020. In 2021, Bitcoin will attract more investors who will push the price upward. By the end of January 2021, the BTC price will reach a high of $35,000. In a nutshell, the crypto is likely to be worth $55,000 at the end of December 31, 2021.
ETH/USD Major Trend: Bullish
In the previous week, Ethereum bulls have been struggling to break the $620 overhead resistance. Ether faced rejection at the recent high as the crypto fell to the low at $540. The price corrected upward but fell again to retest the $540 low before resuming a fresh uptrend. On December 16, the coin rebounded to break the $620 overhead resistance. After the breakout, ETH rallied to a $680 high. The crypto was rejected at the recent high as the price pulled back.
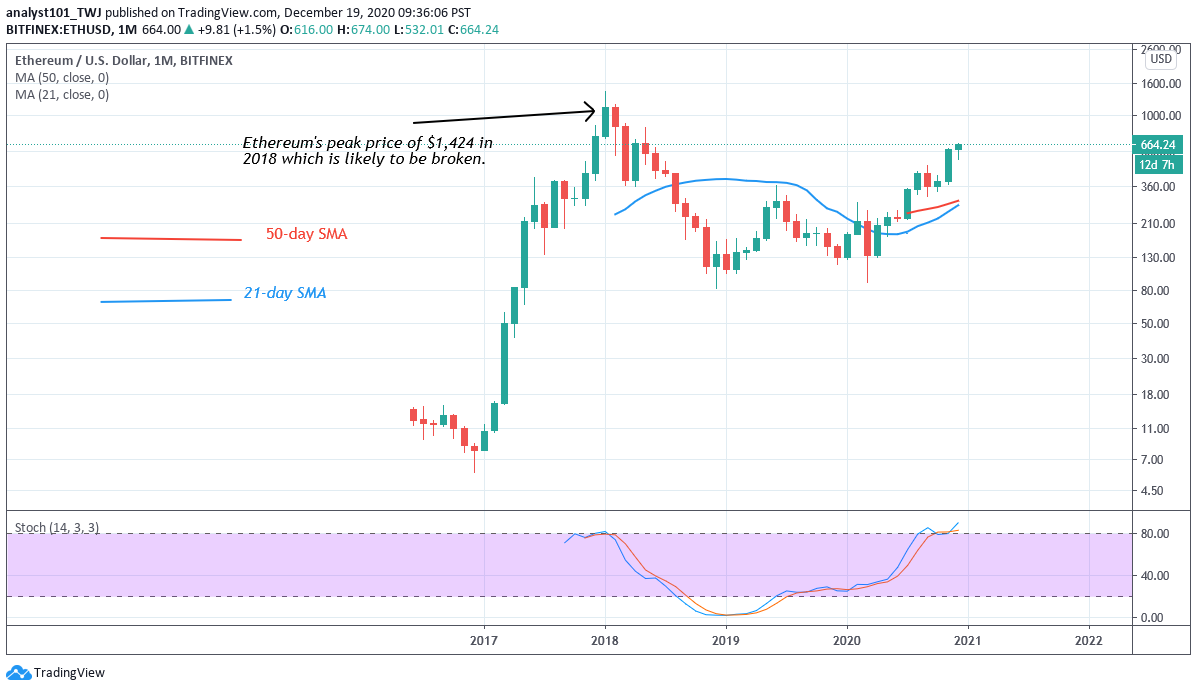
The coin pulled back to the support above $620 and resumed a sideways move between $620 and $680. Meanwhile, the Fibonacci tool has indicated a further upward movement of the coin. On November 23 uptrend; a retraced candle body tested the 50% Fibonacci retracement level. The retracement indicates that Ethereum will rise and reach level 2.0 Fibonacci extension or the high of $800 .62. Ethereum is gradually approaching its peak price of 2018. By December 31, ETH price is likely to reach a high of $1,600. The performance of Ether in 2021 will depend on the performance of the current year. The growth phase will extend to 2021. In other words, Ether will be worth $3000.
XRP /USD Major Trend: Bearish
Ripple has been on a downward move since its rejection at the $0.78 overhead resistance. XRP declined to a low of $0.43. On December 16, the bulls bought dips as the crypto rallied to $0.65 high. But it pulled back because of the resistance at $0.60. As the price broke above the resistance line and closed, the bearish trend has been terminated.
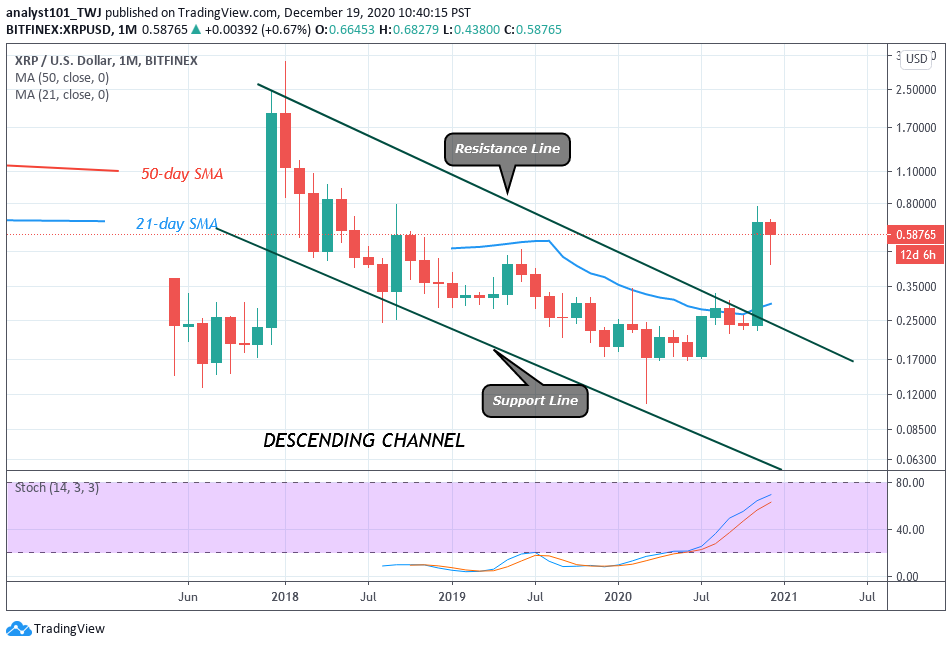
The upward move is likely to resume. Meanwhile, XRP is fluctuating between $0.54 and $0.60 because of the recent resistance. The uptrend will resume once the resistance is breached. Meanwhile, on November 24 uptrend, a retraced candle body tested the 61.8% Fibonacci retracement level. This retracement indicates that XRP will rise to level 1.618 Fibonacci extensions or the high of $1.1177.
From the monthly chart, Ripple has been on a downward correction from 2017 to October 2020. This is one of the reasons why XRP is the worst performing coin. However, in the last quarter, XRP has been making impressive moves. Perhaps, the coin is likely to close at $0.59 by December 31, 2020. Given the performance of XRP in2020, the price may have a steady decline from $0.59 to $0.30 at the end of 2021
BCH /USD Major Trend: Bearish
Last week, Bitcoin Cash fell to $256 low after facing rejection at the $360 and $320 resistance levels. On December 12, the bulls bought the dips as the coin rebounded to the previous highs. BCH rallied to a high of $315 and pulled back. The coin has resumed the upward move as it broke the resistance at $320.
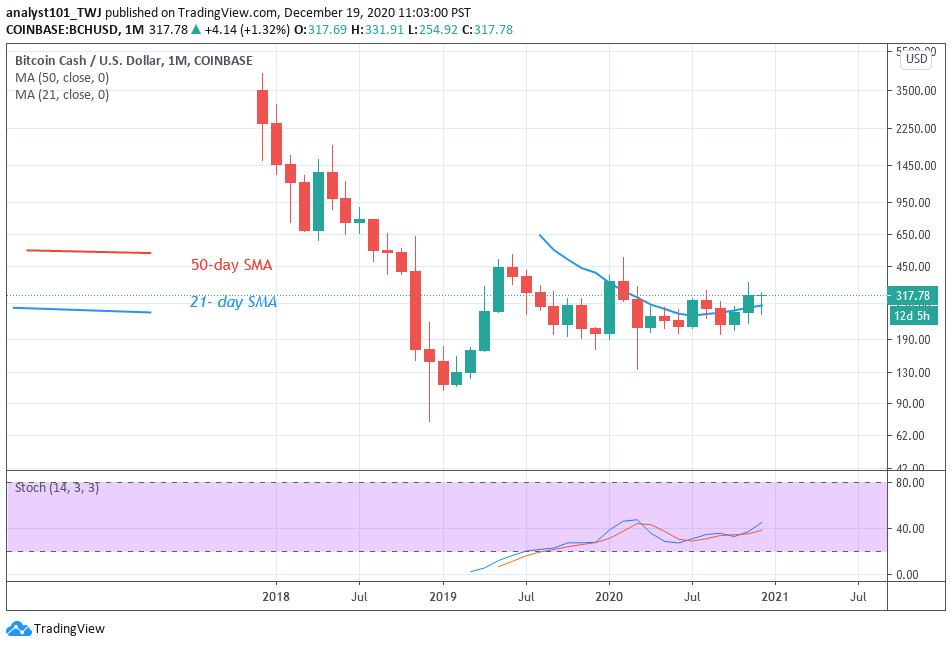
Bitcoin Cash is likely to retest the $360 overhead resistance if the current bullish momentum is sustained. The Fibonacci tool has indicated an upward movement of the coin. On November 17, a retraced candle body tested the 61.8% Fibonacci retracement level. This retracement indicates that BCH will rise to level 1.618 Fibonacci extensions. That is the market will reach a high of $362. Meanwhile, Bitcoin Cash’s performance in 2020 has not been impressive. From the monthly chart, the coin has been in price consolidation in 2020. Today, BCH is trading at $318, but the coin will rise to $350 at the end of 2020. The altcoin will rally to $500 at the end of January 2021. It is expected to appreciate gradually to $750 by end of 2021.


