

This week the coins have all fallen to their respective critical support levels. BTC and Ether have rebounded above their respective lows to push into the previous highs. Currently, the coins are facing stiff resistance which may lead to another fall. BCH and XRP are still confined in the bearish trend zone as the coins push to break into the previous highs.
BTC/USD Major Trend: Bullish
For the past week, Bitcoin (BTC) rebounded above $10,200 as price rallied to reach a high of $11,185. Unfortunately, the selling pressure above the $11,000 resistance was overwhelming as the BTC price dropped sharply on September 23 to a low of $10,152. There were fears that BTC will further decline if the selling pressure extends below $9,800. That is the market will reach the $9,300 low.
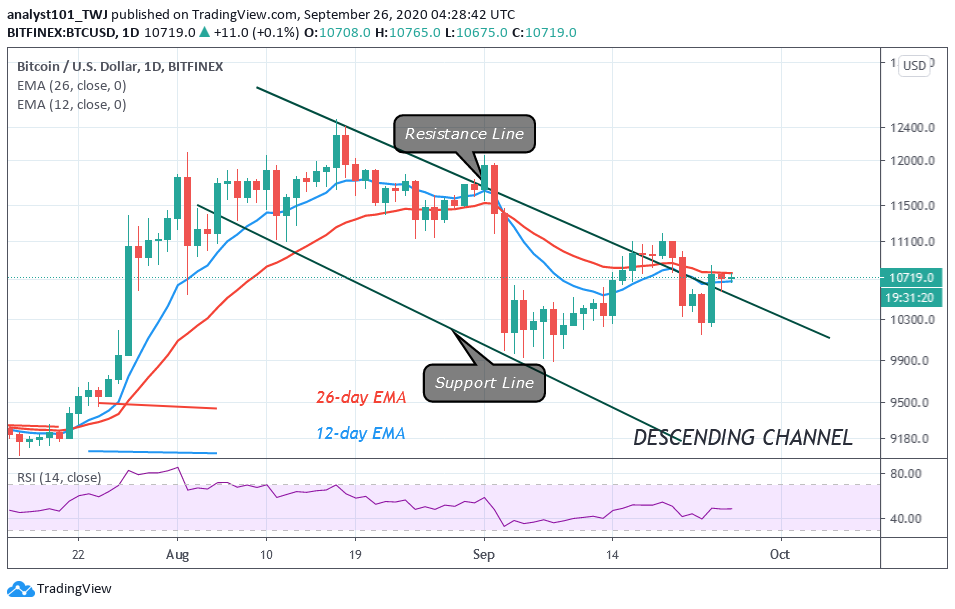
Today, BTC has bounced back as it is trading above $10,700 at the time of writing. Earlier on the psychological support at $10,000 was held as the king coin rebounded above the $10,222 support. There is a possibility of a further upward move as the coin resumes a fresh uptrend.
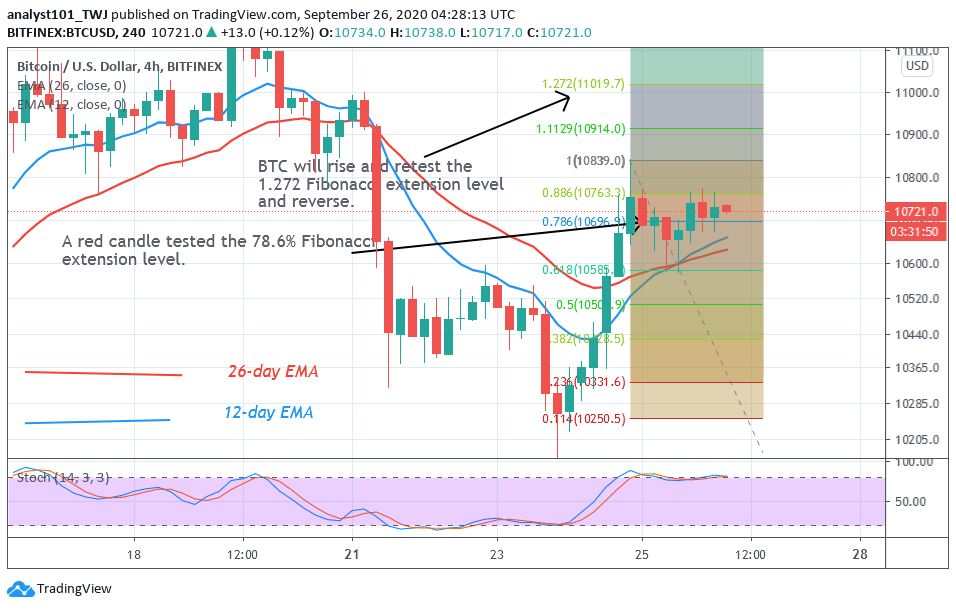
On September 24 uptrend, the crypto reached the $10,842 high but was resisted. The retraced red candle body tested the 78.6% Fibonacci retracement level. This suggests that the market will rise and reach a high of 1.272 Fibonacci extension level. In other words, a high of $11,019.70. However, Bitcoin will again face stiff resistance at the recent high. This will compel it to reverse and return to the 78.6 % extension where it originated. Then further price action will follow.
ETH/USD Major Trend: Bullish
In the last seven days, Ethereum has been falling consistently after reaching the $394 high. The bears broke the support levels of $380 and $360 as ETH found support above $320. Today, the $320 support is holding as Ether rebounds to reach the high of $352. This is an indication of an upward move. Buyers are still pushing the price to the previous highs. If they succeed above the $380 support, it will signal the end of a downward correction.
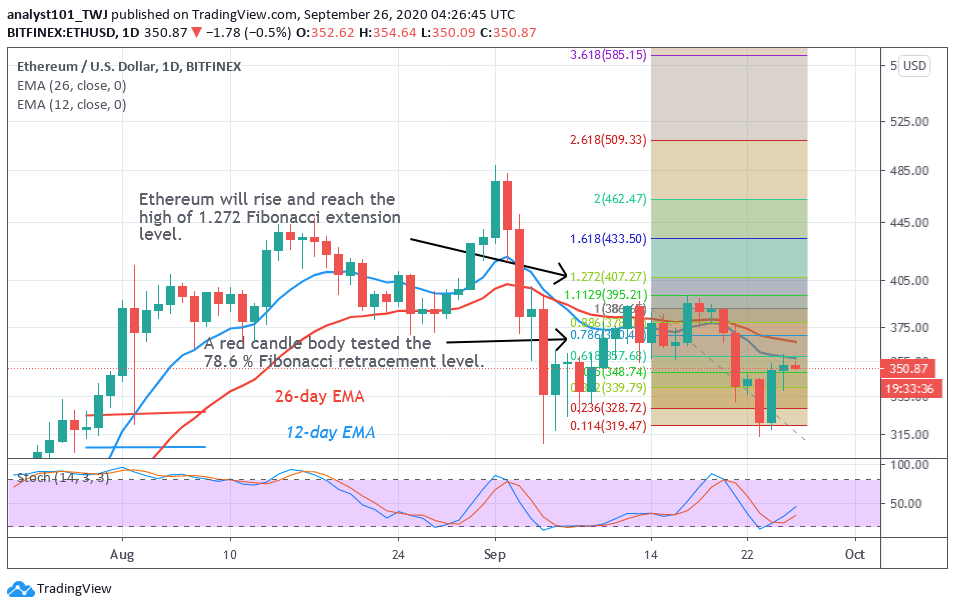
Meanwhile, on September 12 uptrend, Ether reached the $388 but was resisted. The retraced red candle body tested the 78.6% Fibonacci retracement level. This gives the impression that the market will rise and reach a high of 1.272 Fibonacci extension level or the high of $407.27. However, at the recent high Ethereum is likely to face resistance and will retrace to $375 low.
XRP /USD Major Trend: Bearish
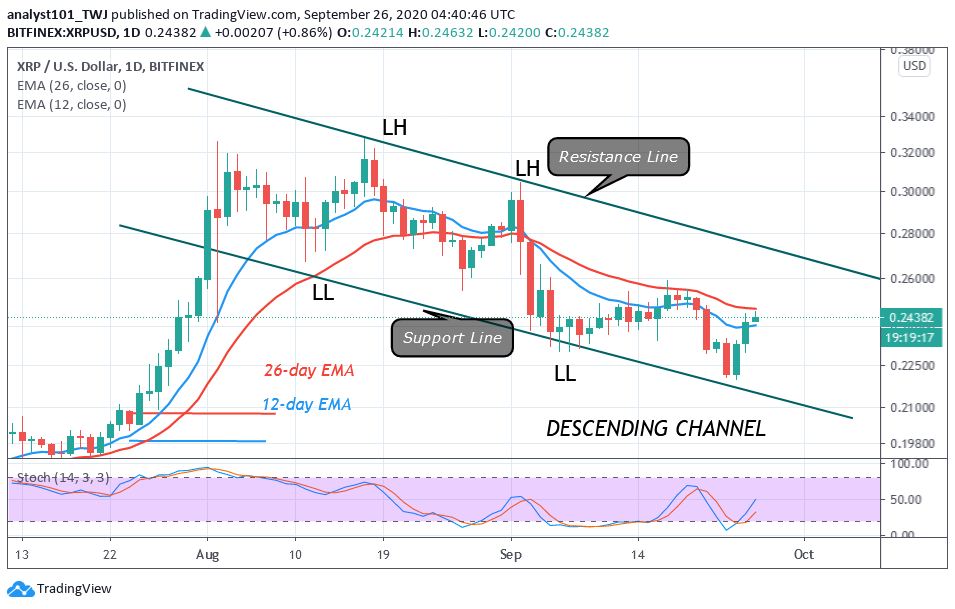
Since August, Ripple has been on a downward move. The price has been making a series of lower highs (LH) and lower lows (LL). Recently, XRP rebounded above the $0.22 support and reached a high of $0.24. On the upside, if the bulls break the resistance line of the descending channel or price breaks the lower highs bearish pattern, it will signal the resumption of the uptrend. However, if the bulls fail to break the lower highs, the downtrend will resume. XRP will further decline to $0.19 low. Meanwhile, XRP is above 30% range of the daily stochastic. It indicates that the coin is in a bullish momentum.
BCH /USD Major Trend: Bearish
In the previous week, sellers have the upper hand as they push the price to $205 and $207 lows twice. There has been a price tussle at the bottom of the chart as buyers attempt to push price above the $220 high. The coin is trading at $217 at the time of writing.
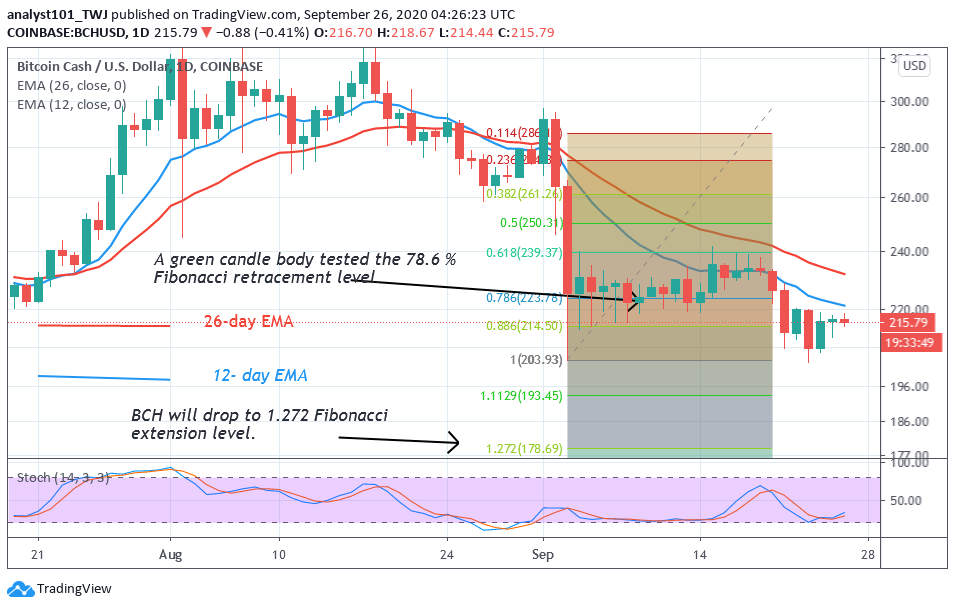
At the same time, the coin is range bound between $205 and $220. On the upside, if buyers push price above $220, the coin will have an accelerated price movement. Perhaps the momentum will extend above $260 and $280 highs. Conversely, if price breaks below $205 and $200 support, the coin will fall and reach the 1.272 Fibonacci extension level. On September 3 downtrend, the market fell and reach a low of $203. However, the retraced green candle body tested the 78.6% Fibonacci retracement level. This gives us the impression that the market will fall and reach a low of 1.272 extensions or $178.


