
In the previous week, the coins were facing selling pressure as the bulls “buy the dips” to push the cryptos out of the bearish trend zone. This week the altcoins have shown signs of upside momentum as important resistance levels have been breached. Bitcoin (BTC) has broken the $11,000 resistance as it prepares to retest the $12,000 overhead resistance.
BTC/USD Major Trend: Bullish
For the past week, Bitcoin was compelled to a range-bound movement for failing to break the $11,000 resistance. The crypto was fluctuating between $10,200 and $11,000.Nonetheless, on October 9, a strong bounce above $10,800 broke the $11,000 resistance. BTC rebounded again above the $11,000 support as price reached the high of $11,400.
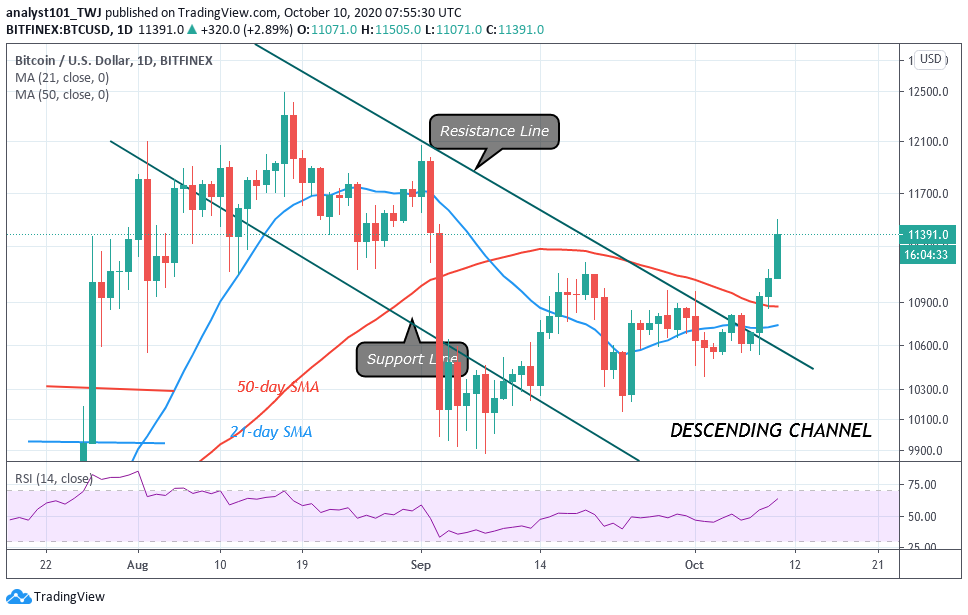
The second bounce breached the resistances between $11,000 and $11,300 as the king coin reached a high of $11,442. The king coin is ready to retest or break the $12,000 overhead resistance if the bulls sustain the current momentum. The crypto will also attempt to retest to $12,400 high. The market will rise to another high if the bulls are successful.
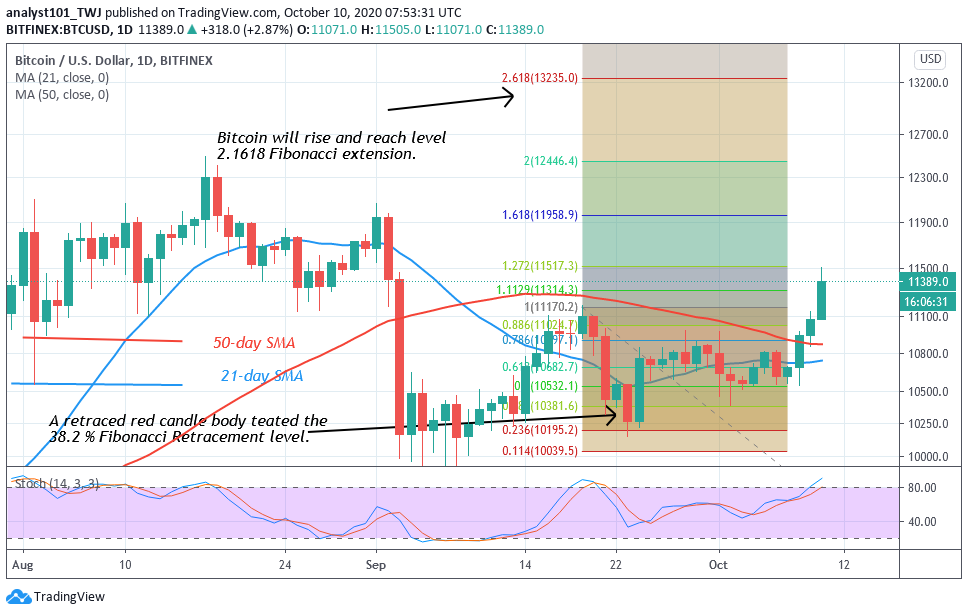
On September 19 uptrend; the bulls were resisted at the $11,185 high. The retraced red candle body tested the 38.2% Fibonacci retracement level. It indicates that if the overhead resistance is cleared, the market will reach level 2.618 Fibonacci extension or the high of $13,235.
ETH/USD Major Trend: Bullish
Last week, to avoid further decline, Ethereum bulls have been struggling to remain above the $350 support. Initially, sellers have the upper hand as they pushed the coin to the low of $335. However, the bulls, buy the dips as the coin rebounded above the $335 low. Today, the coin has risen to $376 high at the time of writing. The biggest altcoin is expected to a further upward move if buyers push the coin above the $380 high.
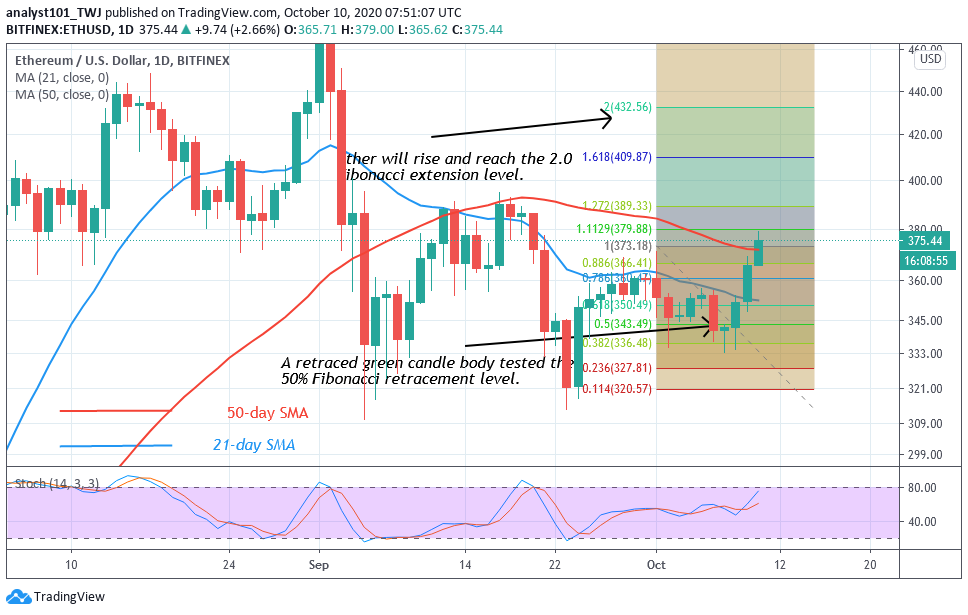
On the upside, the coin is likely to have price acceleration above the $380 support. In other words, the coin is capable of reaching a high of $440.Conversely, if buyers fail to push the coin above the $380 support, Ether will resume a sideways move below the current resistance. Meanwhile, on September 29 uptrend, the coin was resisted at $370, the retraced candle body tested the 50% Fibonacci retracement level. This gives the clue that the market will rise and reach a high of 2.0 Fibonacci extension or the high of $432.56.
XRP /USD Major Trend: Bullish
Since last week, buyers have been able to sustain the price level above the $0.24 support. On the other hand, they were unable to break the resistance at $0.26. XRP has been compelled to fluctuate between levels of $0.24 and $26. On the upside, a break above the $0.26 resistance will propel price to rally above $0.28 high. The momentum will extend to $0.30 high.
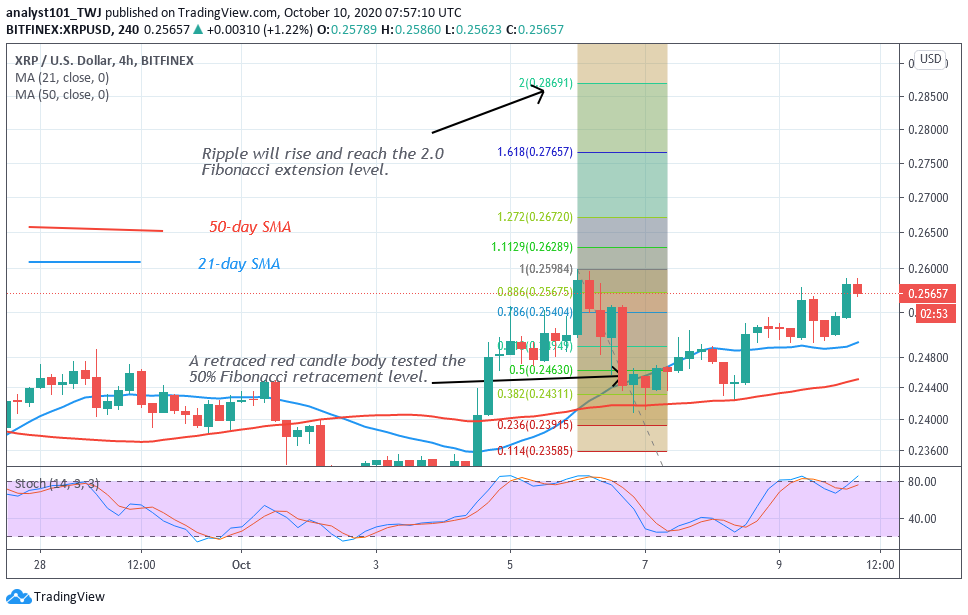
The fluctuations will continue if the bulls fail to break the current resistance. Otherwise, the bears will break below the $0.24 support. The coin is trading at $0.2570 at the time of writing. Ripple is likely to rise once the current resistance is breached. On October 6 uptrend, XRP was resisted, and the retraced candle body tested the 50% Fibonacci retracement level. This indicates that XRP will rise and reach a high of 2.0 Fibonacci extension or the high of $0.286 high.
BCH /USD Major Trend: Bullish
In the previous week, Bitcoin Cash was in a tight range-bound move between levels $215 and $223. On October 6, the coin rebounded but faced immediate rejection at the $230 high. The price fell back into the range bound zone and continued fluctuations. The bulls have broken the resistance at $223 and the coin rebounded above the $223 support. Today, the coin is trading at $242 at the time of writing. For the coin to resume the upside momentum, buyers have to push the coin above the $260 price level.
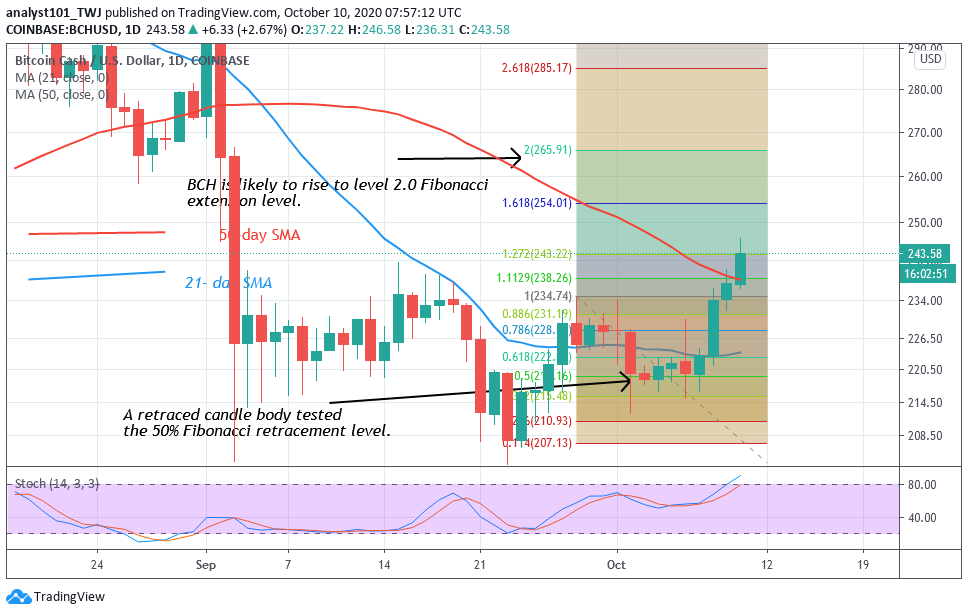
The market will rise to a high of $300 if the bulls are successful. Nonetheless, if buyers fail to break into the previous high, there is a tendency to fall into the range-bound zone. Perhaps, if the bears break below the $215 support, BCH will find support above $203.Meanwhile, on September 27 uptrend, the coin was resisted. The retraced red candle body tested the 50% Fibonacci retracement level. It indicates that the coin will rise and reach the level 2.0 Fibonacci extension level.


