The king coin and the three altcoins are all in a bull market and their respective uptrends are intact. Bitcoin and the other altcoins are generally correlated in the crypto currency market. The rise and fall of Bitcoin will affect most of the altcoins. Today, the coins are recovery from the recent decline.
BTC/USD Major Trend: Bullish
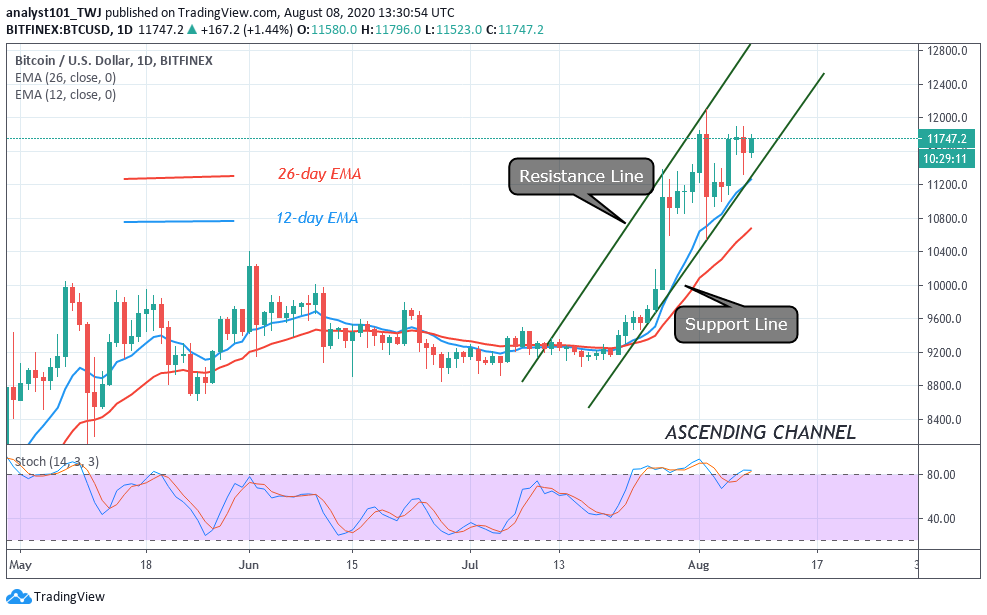
Since August 1, Bitcoin bulls have been making concerted efforts to break above the $12,000. In the first attempt, buyers were repelled as price plunged to $10,548 low. In the second attempt, the market dropped to $11,200. Today, BTC is trading above $11,700 as buyers make another attempt at the resistance. The bottom line is that BTC loses momentum once the price gets to the resistance zone at $11,800. That is the main reason for its recent fall. Alternatively, if price rebounds above the current support, the momentum will propel price to break the $11,800 and $12,000 resistance. Failure of the bulls at the resistance may attract bearish consequences. Sellers on their part can take advantage of bull’s failure to break the $11,000 support. If sellers are successful below the $11,000 support, they can push the coin to $10,500 low.
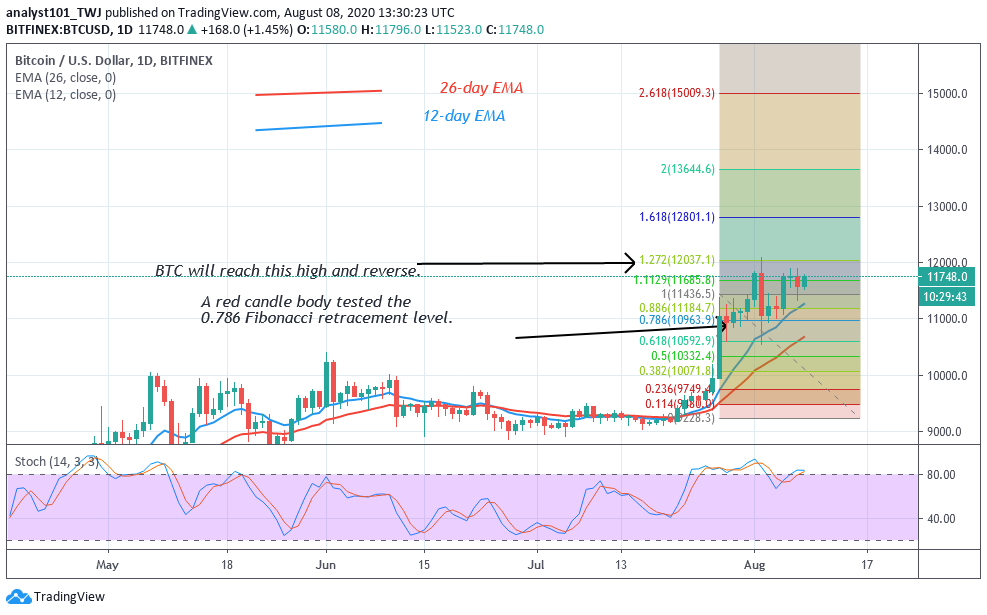
Interestingly, a red candle body tested the Fibonacci tool at the 0.786 retracement level. The candle body indicates that price will rise and reach the 1.272 extension level or the $12,000 resistance. Thereafter, it will reverse and return to the 0.786 retracement. The implication is that price will fluctuate between $11,000 and $12,000 before a breakout will occur.
ETH/USD Major Trend: Bullish
Ethereum seems to be trading in the overbought region since July 24. On August 2, sellers emerged to push prices to the low of $320. Ether corrected upward but unable to push above $400 resistance. Since on August 2, buyers are unable to break the current resistance. Ether rebounded to break the resistance which resulted in a downward move.
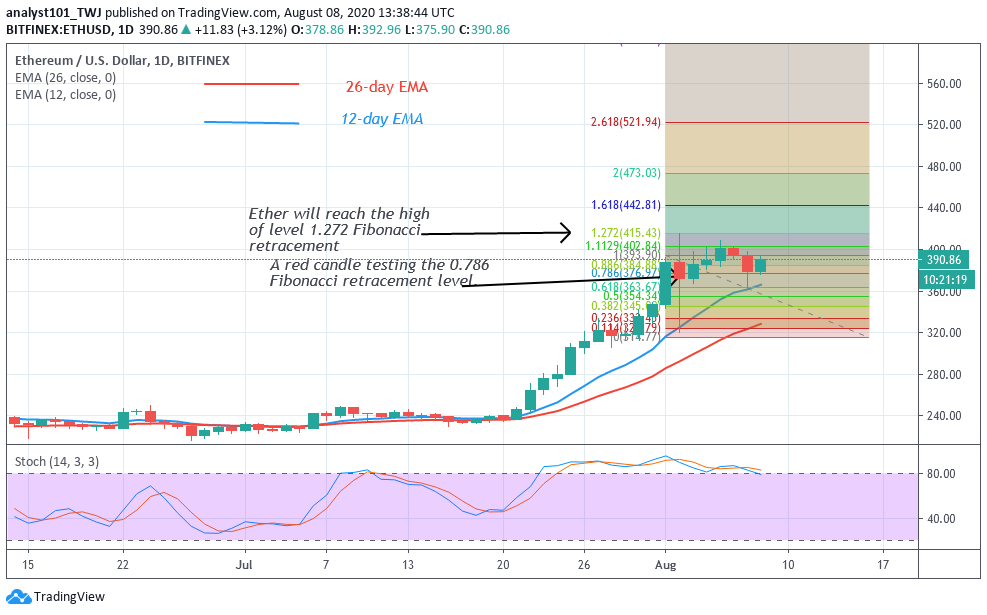
Today, ETH is rising and approaching the resistance zone. A rebound above the current support will catapult the coin above $400 high. The momentum will extend to the $415 price level. In the recent uptrend, the red candle body tested the 0.786 Fibonacci retracement level. The tool indicates that price will rise and reach the 1.272 extension level. This is equivalent to the $415 high. Unfortunately, price will reverse to 0.786 retracement level where it originated. Ether is in a bullish momentum and above 80% range of the daily stochastic.
XRP /USD Major Trend: Bullish
Yesterday, Ripple declined to $0.277 low after failing to break above the $0.32 resistance. Today, buyers have pushed XRP to $0.29 high. XRP has been making an impressive run since the inception of the bull market. It reached its peak price at $0.325 but the market has been on a downward move.
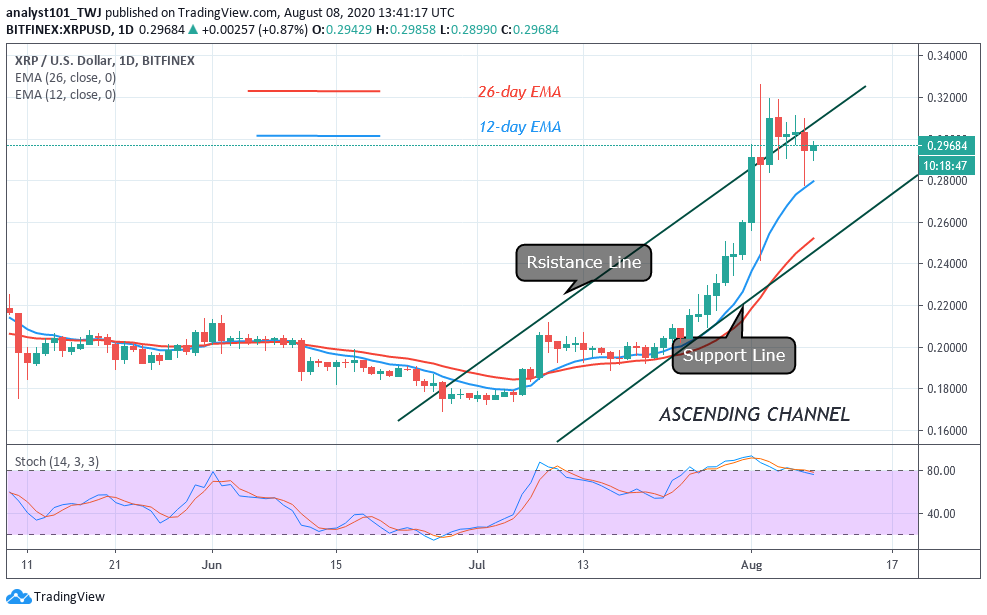
Its major downtrend is to the low of $0.24. Buyers pushed price upward as the coin consolidates between levels $0.28 and $0.32. The market has reached the resistance zone. A possible rebound above $0.29 support will propel price to break the 0.34 resistance at $0.32. The momentum will extend to a high of $0.34. Similarly, if XRP rises and break the resistance line and closes above it, the uptrend will continue. Ripple is also in a bullish momentum as it trades above 80% range of the daily stochastic.
BCH /USD Major Trend: Bullish
Since the last breakdown on August 2, BCH has been fluctuating between $280 and $320 to reach the previous price levels. Price corrected upward after its initial fall to the low at $245. When BCH corrected upward, its first resistance was at $300. It fell again to $280 support level and resumed a fresh uptrend. The price broke the initial resistance at $300 but was resisted at $320. For the past week, Bitcoin cash has been trapped in this range.
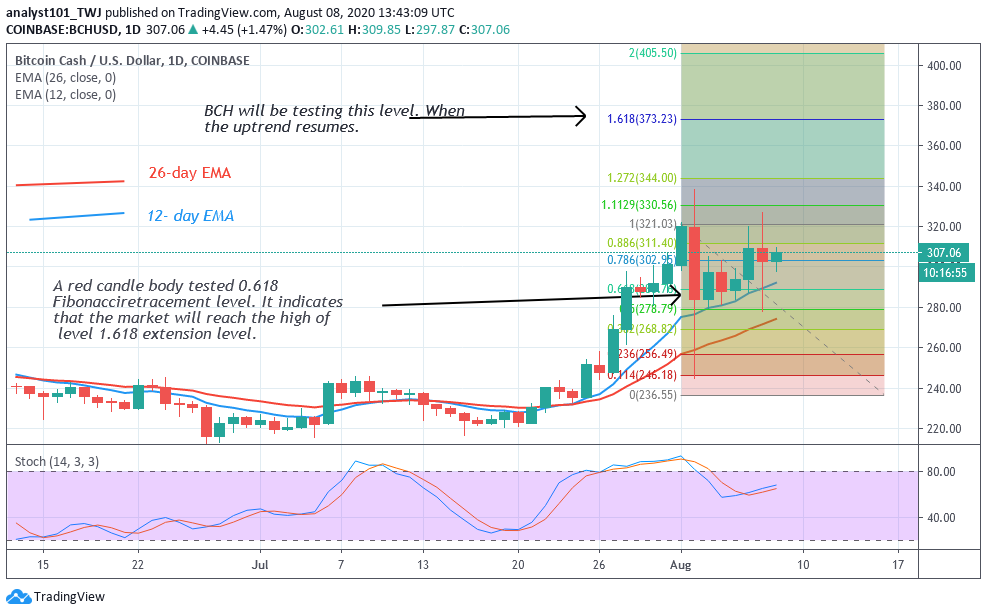
Sellers and buyers are tussling for price possession for a possible breakout. If price rebounds above $300 support, a rally above $340 is likely. Conversely, if the bears break the $280 support, the price will drop to $220 or $240. Nonetheless, during the recent uptrend, a red candle body tested the 0.618 Fibonacci retracement level. This candle body explains that the market will rise and reach level 1.618 Fibonacci extension level. When BCH resumes uptrend, it will reach $380 high.


