
Bitcoin and the altcoins are still trading in a downward correction as it risks further decline. Since April 11, the cryptocurrencies have been trading in a confined range but the cryptos continue to have a sharp downward move. The bears have continued to have an upper hand above the bulls as the cryptos resume downtrend.
BTC/USD Major Trend: Bearish
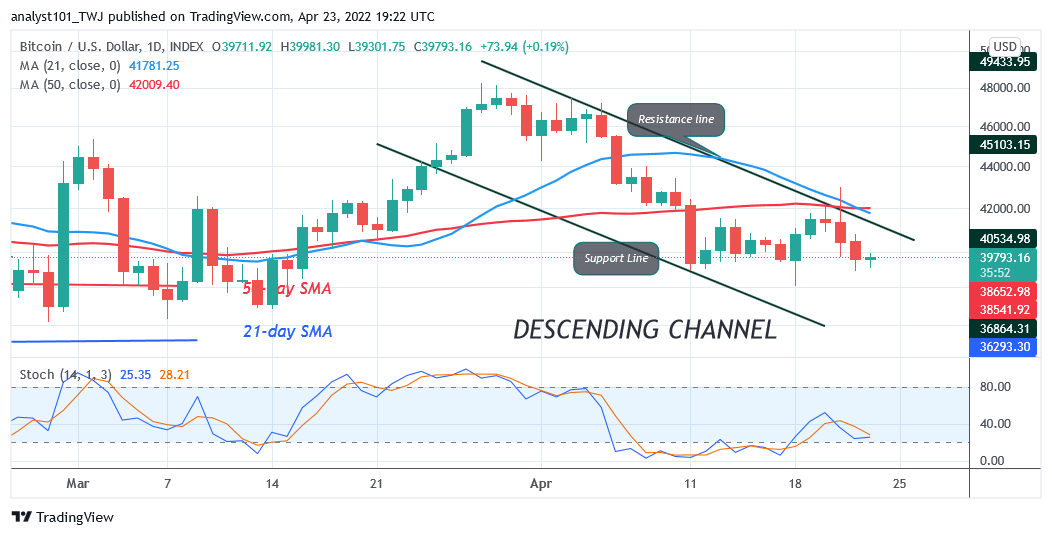
Bitcoin’s (BTC) price is in a downward correction as it loses the $40,000 psychological price level. Since April 11, the price movement has remained the same as the BTC price fluctuates between $39,200 and $42,000 price levels. This week the bears have the upper hand as they attempt to break below the $39,200 support. At the same time, buyers are still defending the current support. Bitcoin will perhaps rebound if the current support holds. This will propel the price to rally above the initial resistance at the $42,000 high. Later, BTC’s price will rise to retest the $45,000 high or break above it. Similarly, if sellers break below the current support, Bitcoin will decline sharply to $37,000 low. Later, the bearish momentum will extend to the low of $33,000.
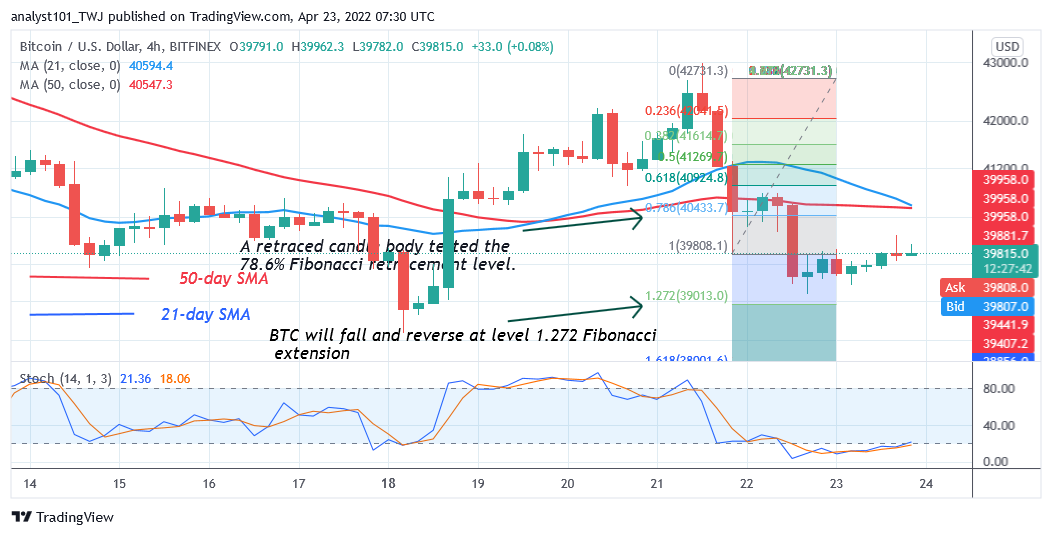
Meanwhile, the crypto is hovering above the $39,330 support as bulls attempt recovery. BTC’s price has been fluctuating below and above the $40,000 psychological price level. Meanwhile, on April 21 downtrend; a retraced candle body tested the 78.6% Fibonacci retracement level. The retracement indicates that BTC price will fall to level 1.272 Fibonacci extension or $39,013 price level.
XRP/USD Major Trend: Bearish
Ripple’s (XRP) price is in a downward correction as price breaks below the moving averages. On April 11, the bears pushed the altcoin to the low of $0.68 as bulls bought the dips. XRP price corrected upward but was repelled at the $0.80 resistance. After a retest at the resistance, the XRP price resumed selling pressure.
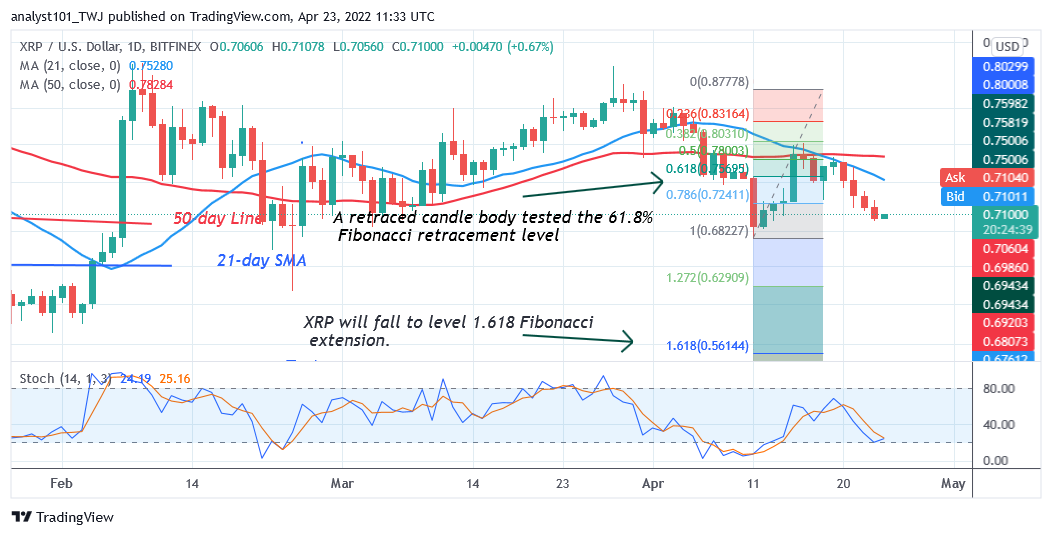
The downtrend is expected to reach a low of $0.68. However, if the bears break below the current support at $0.68, the downtrend will extend to the $0.63 low. Nonetheless, if XRP retraces and finds support above $0.68, the altcoin will be compelled to a range-bound move between $0.68 and $0.80 price levels. Meanwhile, on April 11 downtrend; a retraced candle body tested the 61.8% Fibonacci retracement level. The retracement indicates that XRP will fall to level 1.618 Fibonacci extension or $0.56.
DOT/USD Major Trend: Bearish
Polkadot’s (DOT) price is in a downtrend as the altcoin resumes upward correction. The cryptocurrency fell to the low of $17 and resumed upward correction. The upward correction is stuck at the $19 high. DOT/USD will rally to $23 if the bulls break the recent high.
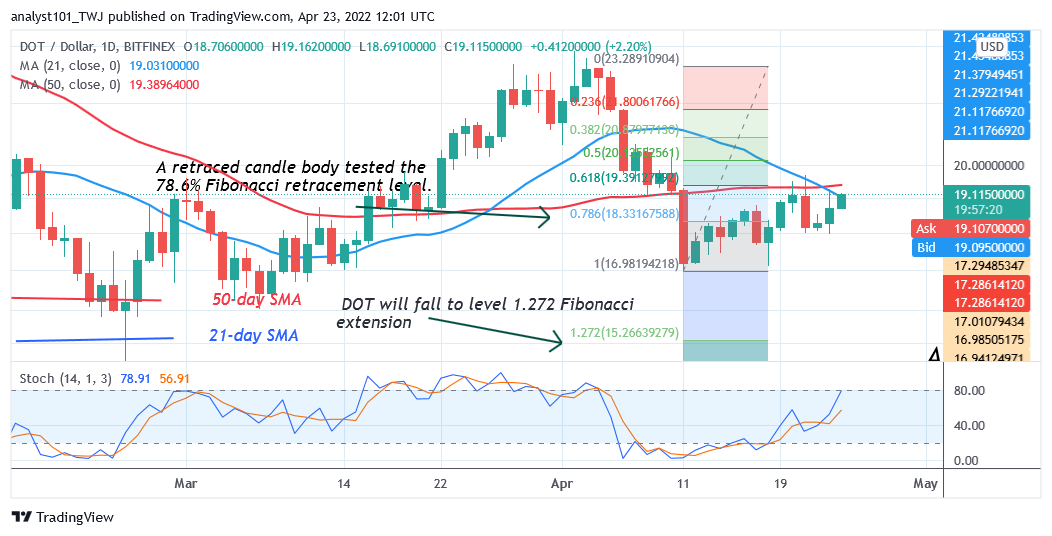
On the other hand, the selling pressure will resume if the bulls fail to break the recent high. The crypto’s price will fall and revisit the previous low at $17. The downtrend will resume if the current support is broken. Meanwhile, on April 11 downtrend; a retraced candle body tested the 78.6% Fibonacci retracement level. The retracement indicates that DOT will fall to level 1.272 Fibonacci extension or $15.26
LTC /USD Major Trend: Bearish
Litecoin’s (LTC) price is in a downtrend as the altcoin fell below the moving averages. In the first bearish impulse on April 11, Litecoin declined to the low of $102. The bulls bought the dips as the LTC price corrected upward. The upward move was repelled at the $115 resistance zone.
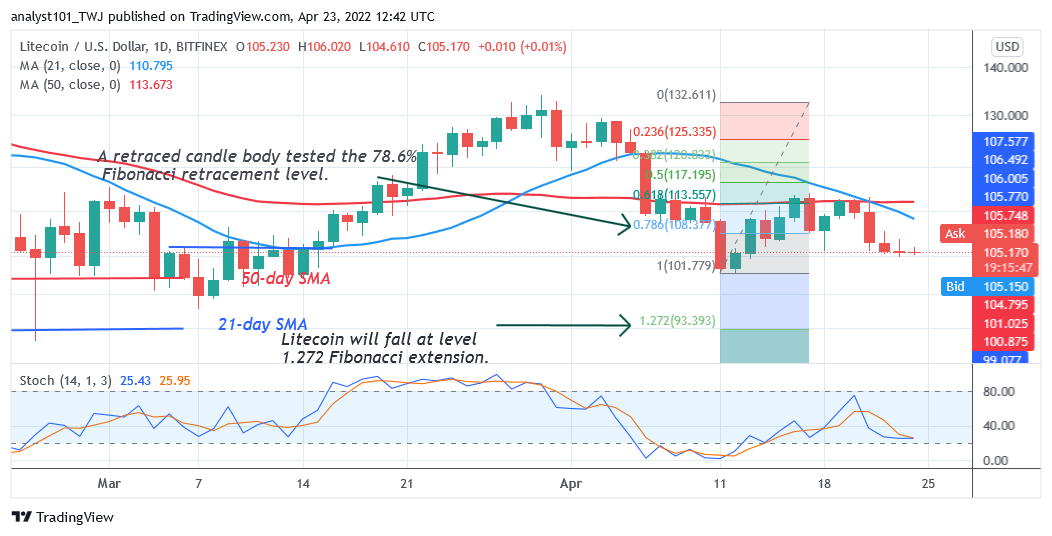
The cryptocurrency has resumed selling pressure after the bulls retested the resistance zone twice. Litecoin is expected to revisit the previous low at $102. The altcoin will be compelled to a range-bound move between $102 and $115 price levels if the $102 support holds. Meanwhile, on April 11 downtrend; a retraced candle body tested the 78.6% Fibonacci retracement level. The retracement suggests that the LTC price will fall to level 1.272 Fibonacci extension or $93.39. From the price action, if the $102 support is broken, the altcoin will retest level 1.272 Fibonacci extension.
LINK /USD Major Trend: Bearish
Chainlink’s (LINK) price is in a downward correction as it risks further decline . The altcoin fell to the low of $13.53 on April 11. For the past two weeks, the LINK price has been consolidating above the $13.53 support. Also, Chainlink has been trading below the moving averages and above the $13.53 support.
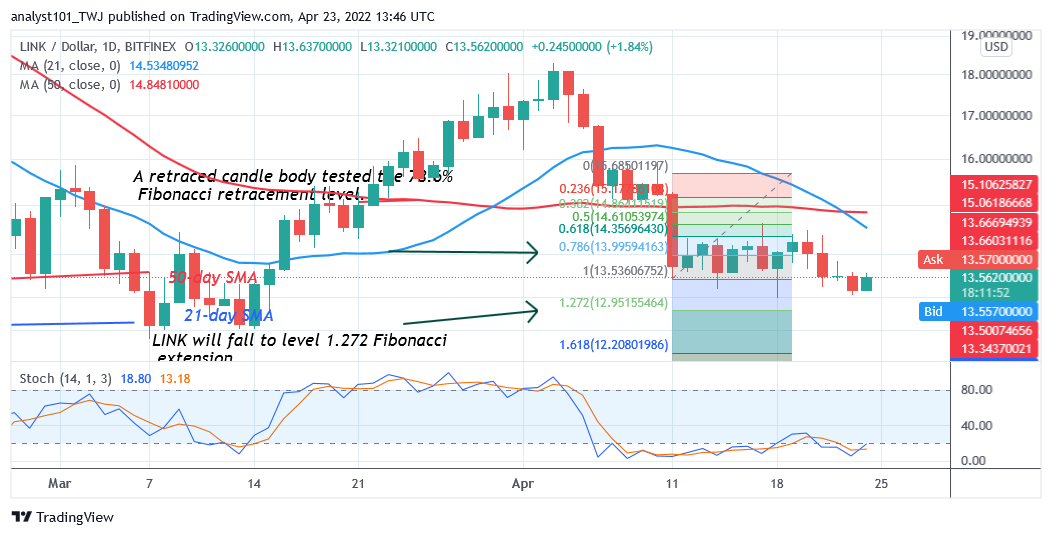
The upward move has been restricted below the $15 resistance zone. On April 23, the bears broke below the $13.53 support as bulls bought the dips. Presently, Chainlink is trading in a tight range between $13.50 and $15 price levels. It will revisit the previous low at $12 if the current support is breached. On the other hand, if price breaks above the $15 resistance, the altcoin will rally above the moving averages. The bullish momentum will extend to the high of $18. Meanwhile, on April 11 downtrend; a retraced candle body tested the 78.6% Fibonacci retracement level. The retracement suggests that the LINK price will fall to level 1.272 Fibonacci extension or $12.95


