
Bitcoin and the altcoins have all fallen to the oversold region of the market. This implies that the downtrend has reached bearish exhaustion. Further selling pressure is unlikely as buyers emerge in the oversold region. This week some of the cryptocurrencies will encounter a price rebound.
BTC/USD Major Trend: Bearish
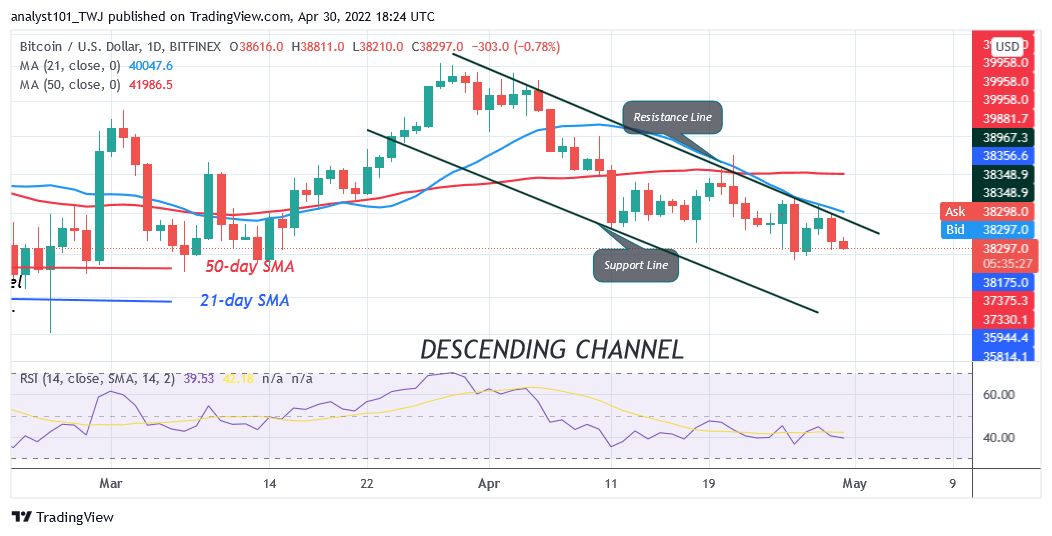
Bitcoin’s (BTC) price is in a downtrend as the cryptocurrency falls below the previous low. In a nutshell, on April 11, Bitcoin declined to $39,223 low and was compelled to a sideways move between $39,223 and $42,000 price level for two weeks. On April 26, the bears broke the lower price range as Bitcoin further declined to the low of $37,727. Today, the bears have broken the current support as the largest cryptocurrency reached the low of $37,633. BTC price has fallen to the oversold region. Further selling pressure is unlikely as buyers emerge in the oversold region of the market. On the upside, if BTC price rebounds, Bitcoin will rally above the $40,000 psychological price level.
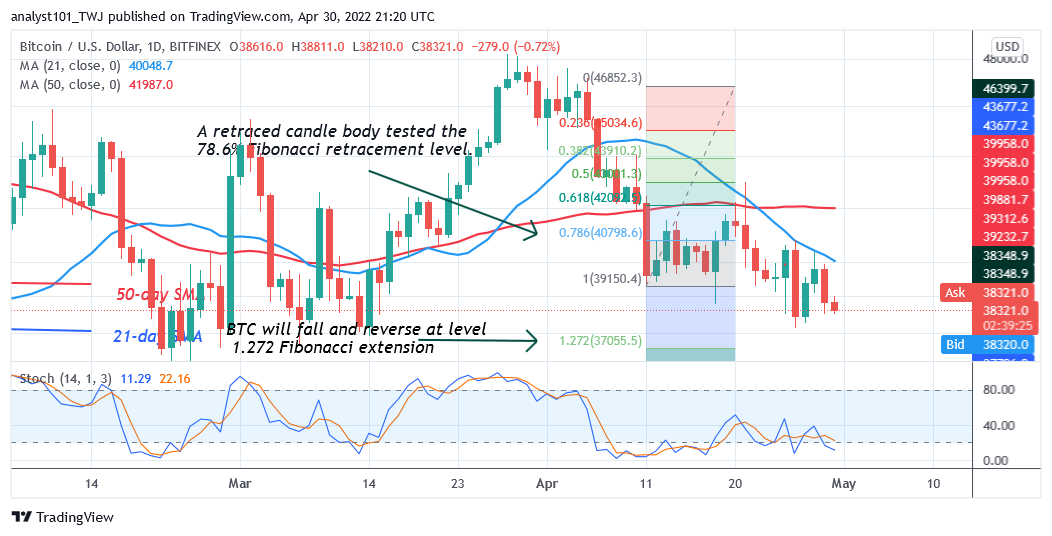
The largest cryptocurrency will resume upside momentum if the bullish momentum extends above the moving averages. The crypto will revisit the previous highs of $42,000 and $45,000 price levels. Meanwhile, on April 11 downtrend; a retraced candle body tested the 78.6% Fibonacci retracement level. The retracement indicates that BTC will fall but reverse at level 1.272 Fibonacci extension or $37,055.50 price level.
XRP/USD Major Trend: Bearish
Ripple’s (XRP) price is in a downtrend as the cryptocurrency falls to the oversold region. XRP has been in a downward move after reaching the high of $0.85. The altcoin fell to the low of $0.75 and resumed upward correction. The selling pressure resumed after the upward correction was terminated at the high of $0.80.
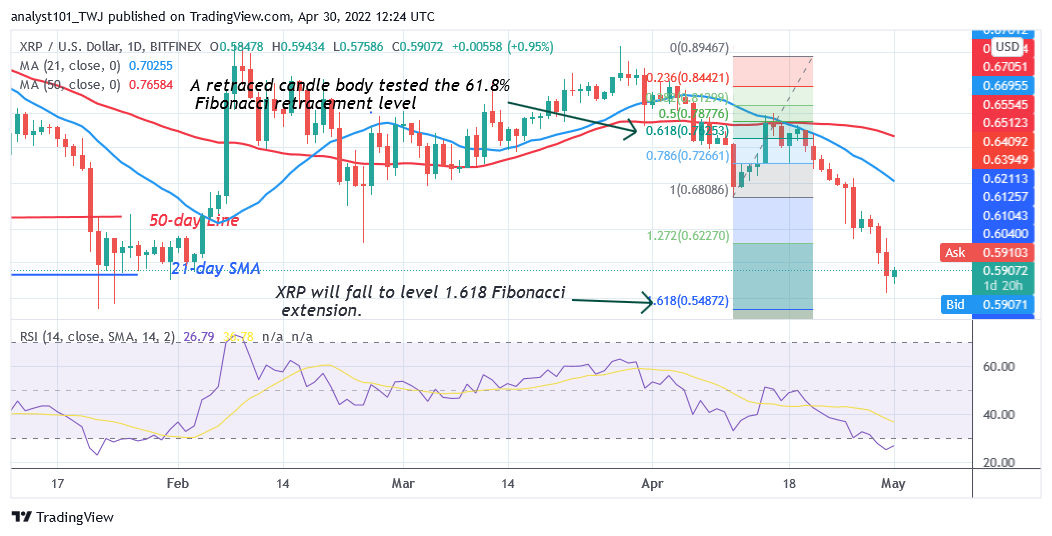
Today, XRP/USD has fallen to the low of $0.56 as bulls bought the dips. XRP is at level 25 of the Relative Strength Index for period 14. It indicates that XRP/USD is trading in the oversold region of the market. Also, the current downtrend has reached bearish exhaustion. Meanwhile, on April 11 downtrend; a retraced candle body tested the 61.8% Fibonacci retracement level. The retracement indicates that XRP will fall to level 1.618 Fibonacci extension or $0.54.
DOT/USD Major Trend: Bearish
Polkadot’s (DOT) price is in a downtrend and the altcoin has fallen significantly to the downside. On April 3, Polkadot rallied to the high of $23 but reached the overbought region. The altcoin dropped sharply to the low of $17 but corrected upward. The selling pressure resumed as the altcoin faced rejection at the high of $19.
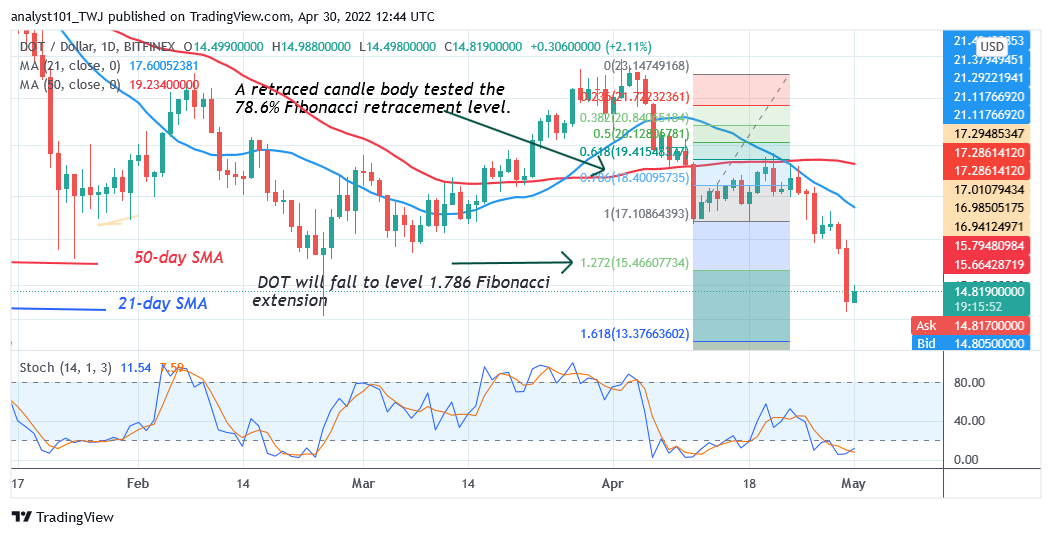
Today, DOT/USD has reached the low of $14 as bulls bought the dips. The cryptocurrency has reached bearish exhaustion as the market reached the oversold region. Besides, buyers are expected to emerge in the oversold region as price is below the 20% range of the daily stochastic. Meanwhile, on April 11 downtrend; a retraced candle body tested the 78.6% Fibonacci retracement level. The retracement indicates that DOT will fall to level 1.272 Fibonacci extension or $15.26. From the price action, the altcoin has retested level 1.272 Fibonacci extension and resumed upward.
LTC /USD Major Trend: Bearish
Litecoin’s (LTC) price is in a downtrend as the altcoin resumes a downtrend. In the previous price action, Litecoin rallied to the high of $134. However, the bulls could not sustain the bullish momentum as the altcoin fell below the moving averages. On April 11, Litecoin fell to the low of $102 and resumed upward correction.
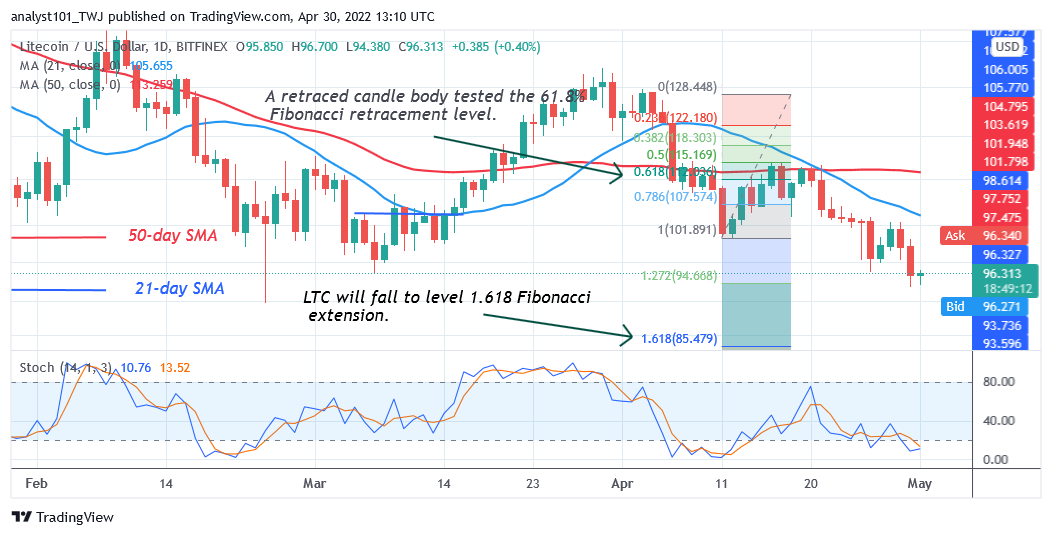
The bulls could not keep the price above the $115 resistance. Litecoin was repelled after two rejections at the recent high. The recent decline has pushed the cryptocurrency below the 20% range of the daily stochastic. It indicates that the market has reached the oversold region. Buyers will emerge to push prices upward. Meanwhile, on April 11 downtrend; a retraced candle body tested the 61.8% Fibonacci retracement level. The retracement indicates that LTC will fall to level 1.618 Fibonacci extension or $85.47. From the price action, the altcoin has fallen to the low of $94.
LINK /USD Major Trend: Bearish
Chainlink’s (LINK) price is in a downtrend as price plunged to the low of $10.66. On April 3, the cryptocurrency rallied to the high of $18.30 but could not continue the uptrend.
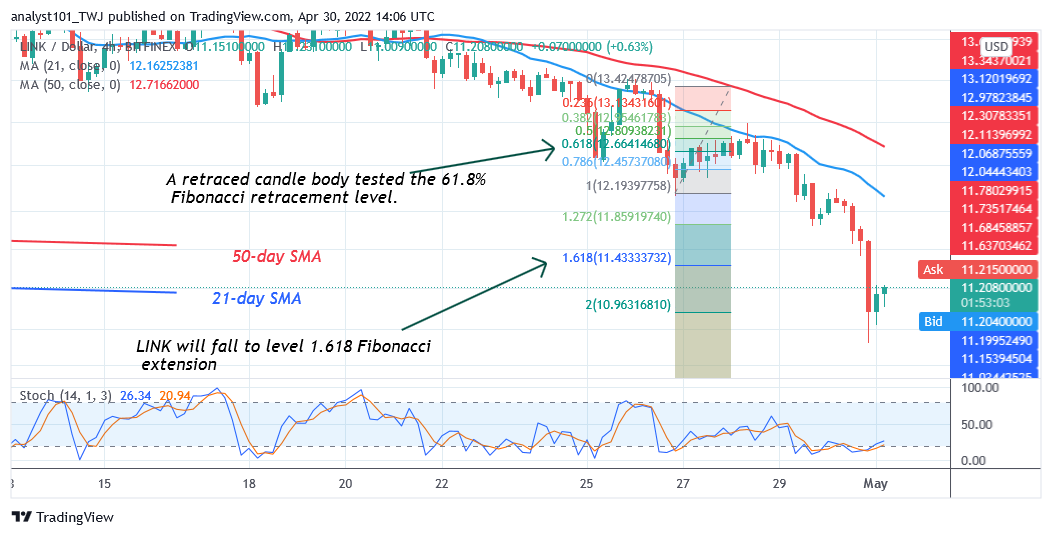
The altcoin reached the overbought region of the market. The coin declines to the low of $13.50 and resumes consolidation above the current support. The bears broke the current support as the market resumes selling pressure. Meanwhile, on April 26 downtrend; a retraced candle body tested the 61.8% Fibonacci retracement level. The retracement indicates that LINK will fall to level 1.618 Fibonacci extension or $11.43. From the price action, the altcoin has fallen to the low of $11.83 and resumed upward.


