
Bitcoin and the altcoins have continued to rebound as the cryptos attempt to break the overhead resistance levels. It is most likely that the cryptos will resume upside momentum once the overhead resistance levels are breached. Let us examine each of these coins.
BTC/USD Major Trend: Bullish
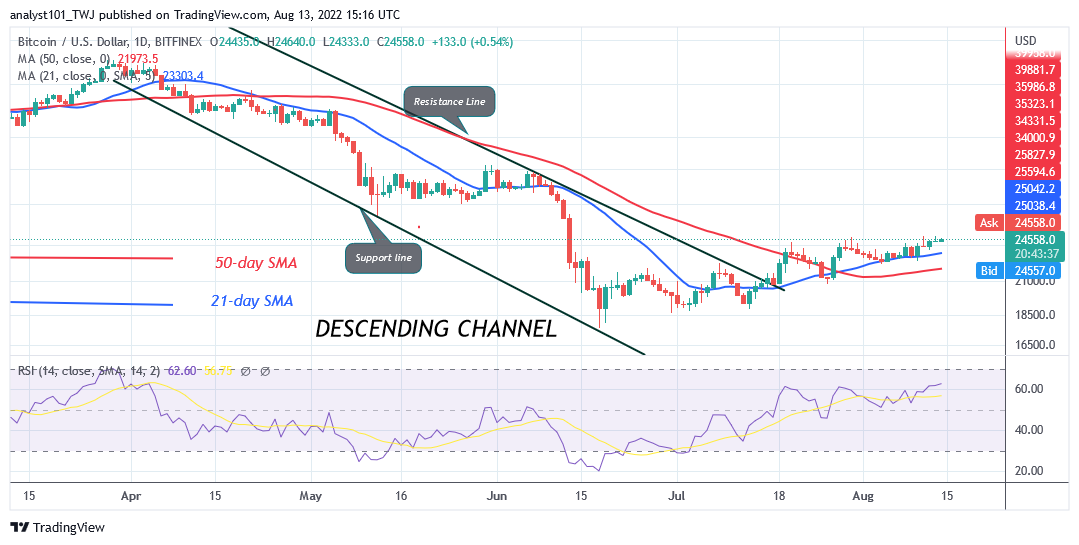
Since July 19, Bitcoin’s (BTC) price has been trading in the bullish trend zone as buyers struggle to breach the $24,000 overhead resistance and sustain the bullish momentum above it. The bulls have retested the overhead resistance on four occasions but failed to breach the recent high. On August 13, the BTC price reached the high of $24,900 and pulled back. This will be the second time, it will pull back after reaching the high of $24,900. Today, the BTC price has continued its bullish move to breach the recent high.
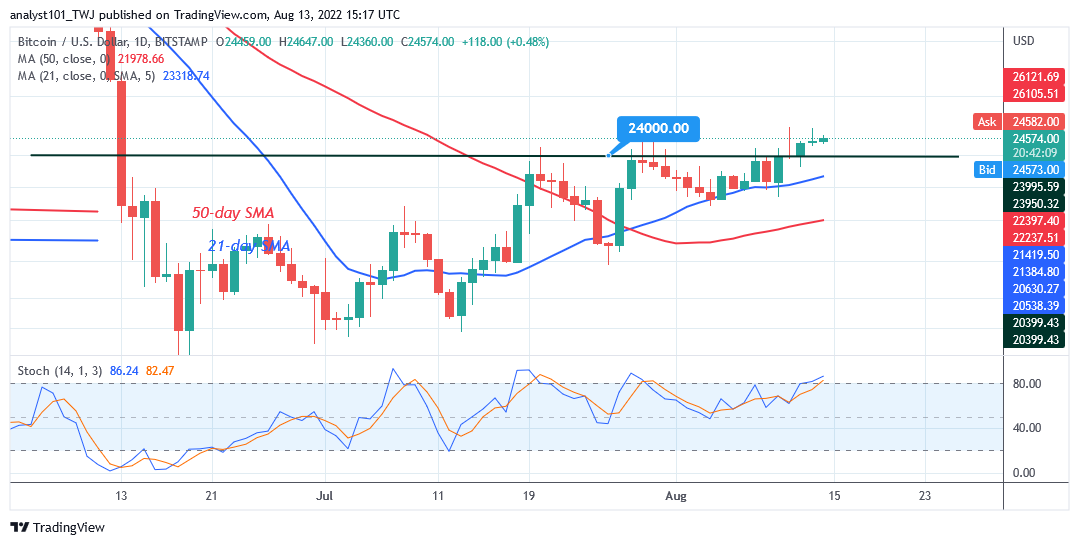
On the upside, if the bulls breach the high of $24,900 and sustain the bullish momentum above the $25,000 support, it will signal the resumption of upside momentum. The largest cryptocurrency will now rise to the highs of $28,000 and $32,000 price levels. Conversely, the bullish scenario will be invalidated if Bitcoin turns from the overhead resistance. Bitcoin will decline and probably break below the 20-day line SMA. In the meantime, BTC/USD is trading at $24,581 at the time of writing. Meanwhile, Bitcoin is at level 61 of the Relative Strength Index for period 14. It indicates that it is in the bullish trend zone and may further rise.
SAND/USD Major Trend: Bullish
The Sandbox (SAND) price has been trading above the moving average lines since June 25. The price movement has remained stagnant between the $1.20 and $1.40 price levels. The Doji candlesticks have been responsible for the insignificant price movement.
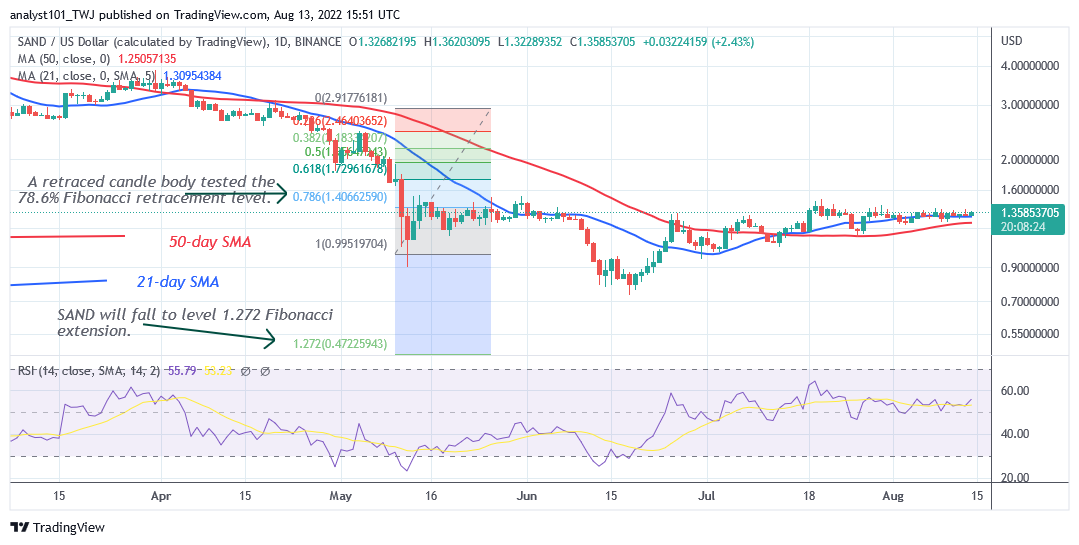
The small body candlesticks are indicating that buyers and sellers are undecided about the direction of the market. Today, the coin is rising to the upside. On the upside, if the bulls breach the $1.40 resistance, the altcoin will rally to the high of $1.93. On the downside, the SAND will decline if the bears break below the moving average lines. The altcoin will decline to the $1.05 support. Meanwhile, SAND is at level 55 of the Relative Strength Index for period 14. It indicates that SAND is in the bullish trend zone and may further rise.
MANA/USD Major Trend: Bullish
Decentraland (MANA) price is in an uptrend as price breaks above the moving average lines. The cryptocurrency has risen to the high of $1.08 which is the historical price level of June 1.
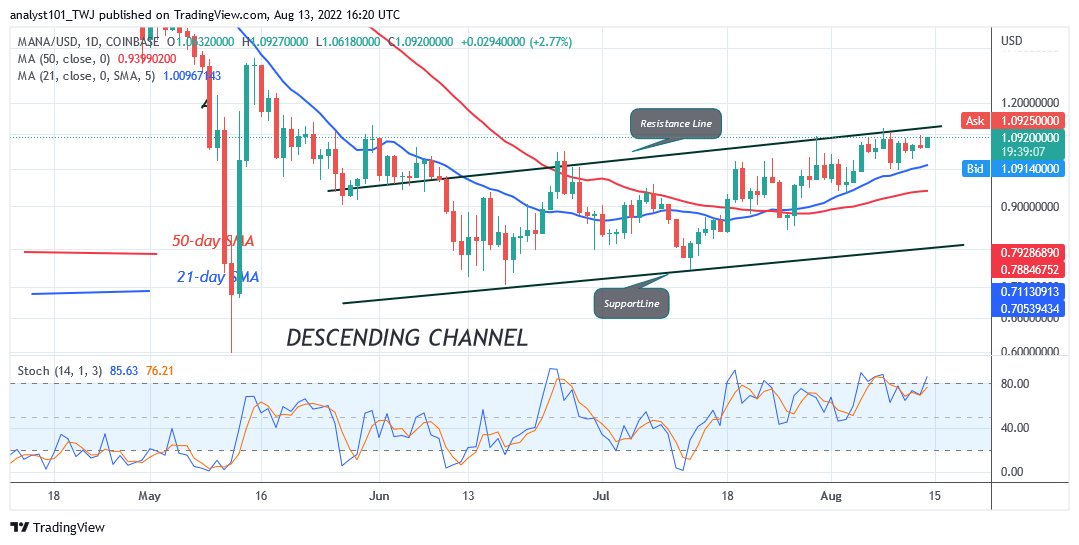
On the upside, if the bulls breach the resistance at $1.09, the altcoin will rally to the $1.34 price level. However, the bullish scenario is doubtful as the market approaches the overbought region of the market. Nonetheless, in the overbought region, the altcoin may decline as sellers emerge. The selling pressure will resume if the bears break below the moving average lines. MANA is above the 70% range of the daily stochastic. It indicates that the market is in a bullish momentum.
APE /USD Major Trend: Bullish
ApeCoin’s (APE) price is in an uptrend as the price breaks above the moving averages lines. The price action is characterized by Doji candlesticks.
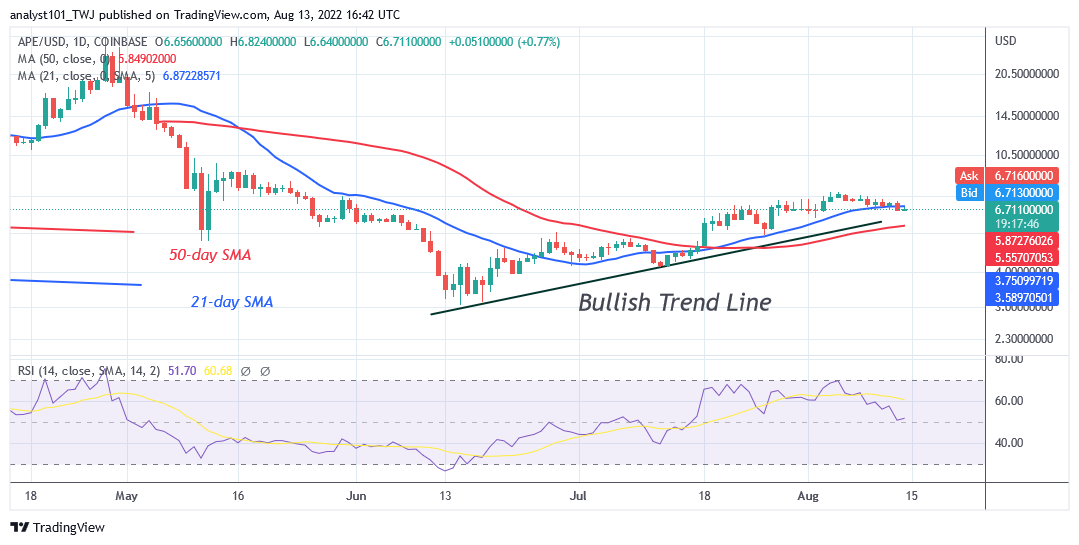
For the past week, the price movement has remained stagnant because of indecision candlesticks. Today, the bears have broken below the 21-day line SMA but above the 50-day line SMA. The implication is that the coin will resume range bound move between the moving average lines. The selling pressure will persist if the price breaks below the 50-day line SMA. The altcoin will revisit the previous low of $5.42. Meanwhile, APE is at level 51 of the Relative Strength Index for period 14. It indicates that there is a balance between supply and demand.
ENJ /USD Major Trend: Bullish
Enjin Coin (ENJ) price has resumed uptrend as price breaks above the moving averages lines. The coin has risen to the high of $0.74 and is approaching the high of $0.77.
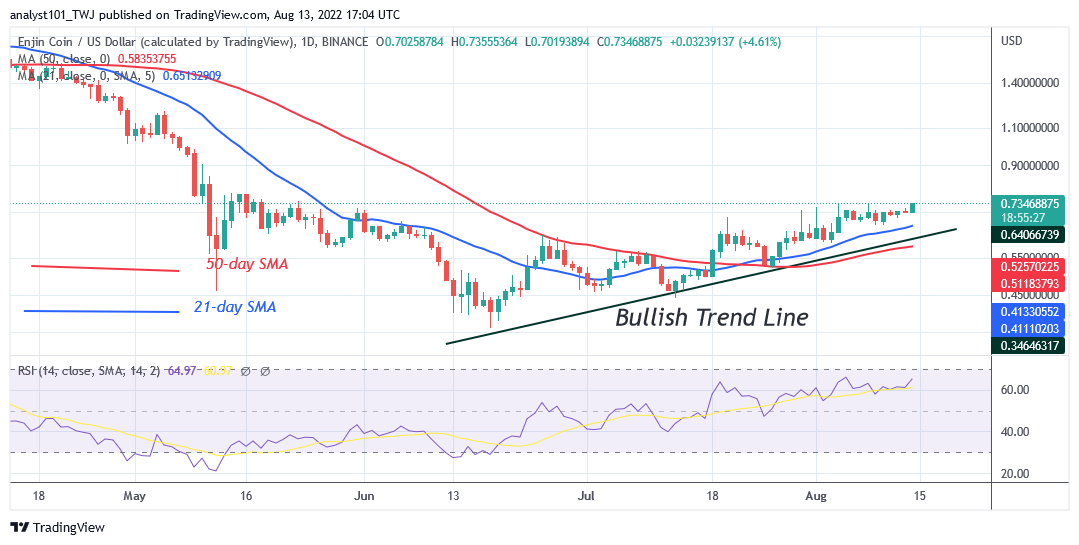
The $0.77 price level is the historical price level of May 14. On the upside, if the bulls breach the $0.77 high, the market will rally to the high of $0.90 and $1.18 price levels. On the other hand, if altcoin turns from the recent high, the market will decline and find support above the $0.54 price level. The ENJ/USD is trading at $0.73 at the time of writing. Meanwhile, ENJ is at level 65 of the Relative Strength Index for period 14. It indicates that the altcoin is in the uptrend zone and may further rise. It indicates that ENJ is in the bullish trend zone and may further rise.


