
The cryptocurrencies below have regained bullish momentum as the coins rallied to their respective overhead resistance levels. Bitcoin and the other cryptos are facing selling near the overhead resistance resulting in a range-bound move in the short-term. The cryptos will resume a fresh uptrend if prices retrace and hold above the moving average lines.
BTC/USD Major Trend: Bullish
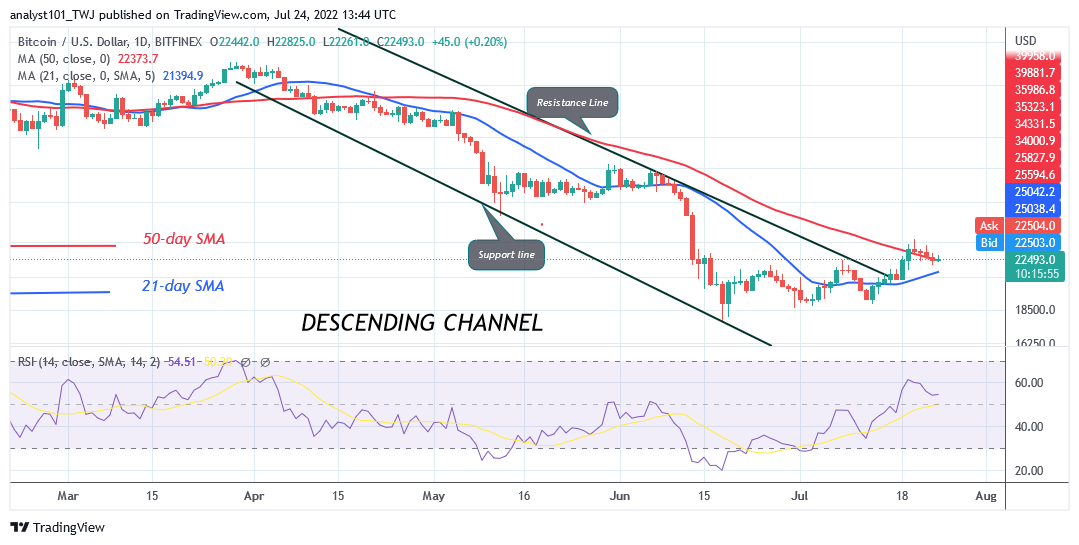
Bitcoin’s (BTC) price is trading in the bullish trend zone. On July 20, the BTC price faced rejection at the $24,000 high as it slumped above the moving average lines. The cryptocurrency is struggling to hold above the 50-day line SMA. On the downside, if the BTC price breaks below the 50-day line SMA, Bitcoin will fall to the range-bound zone. The largest cryptocurrency will be compelled to a range-bound move between the moving average lines.
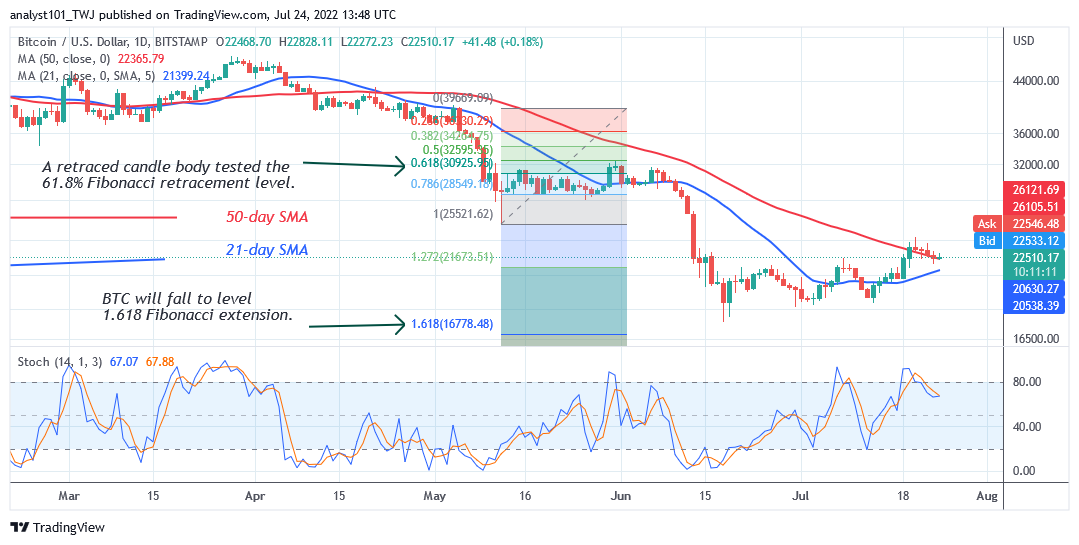
Nonetheless, if Bitcoin finds support above the moving average lines, the uptrend will resume. On the upside, if buyers keep the price above $24,000 resistance , Bitcoin will rally to $28,000. The bullish momentum will extend to the high of $30,000 price level. Meanwhile, Bitcoin is at level 56 of the Relative Strength Index for period 14. It indicates that Bitcoin is in an uptrend zone and capable of further upward.
SAND/USD Major Trend: Bullish
The Sandbox (SAND) price is trading in the bullish trend zone. Since July 14, the bulls have broken above the moving average lines. The uptrend has been terminated at the $1.50 resistance level. Since July 19, the altcoin has been fluctuating below the $1.50 high as it resumed a sideways move.
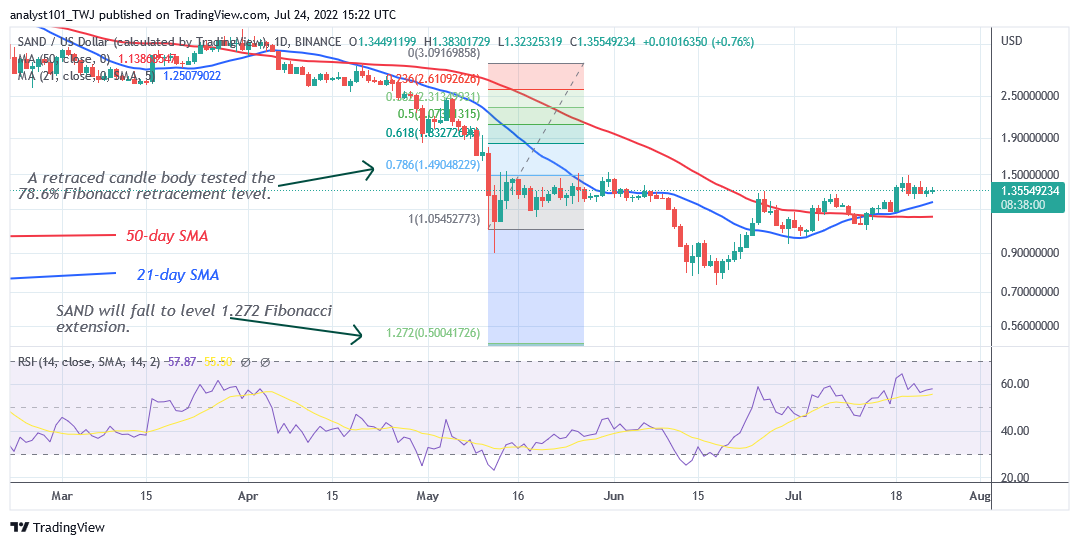
On the upside, if the bulls break the resistance at $1.50, the market will rally to the high of $2.05 price level. Conversely, if the altcoin turns away from the high of $1.50, and bears break below the moving average lines, the selling pressure will resume. The altcoin will decline to the previous low at the $1.08 price level. Meanwhile, SAND is at level 56 of the Relative Strength Index for period 14. It indicates that SAND is in an uptrend zone and capable of further upward.
MANA/USD Major Trend: Bullish
Decentraland (MANA) price is trading in the bullish trend land as price breaks above the moving average lines. On July 19, the altcoin rallied to the high of $1.02 but was repelled. For the past week, the altcoin has been consolidating below the $1.02 resistance. It will rally to $1.10 and $1.24 if the bulls break the recent high.
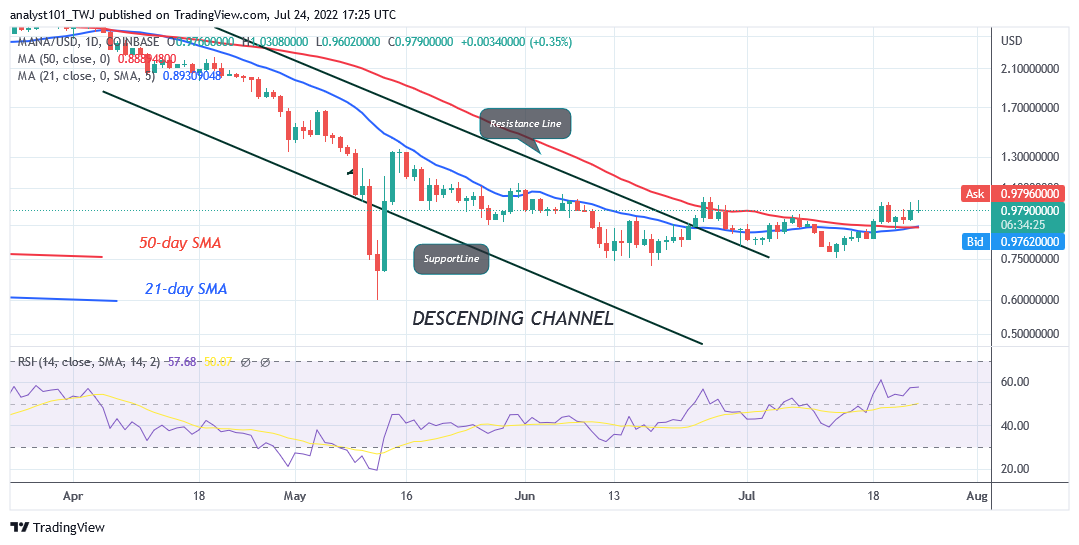
However, MANA risk decline below the moving average lines if buyers fail to keep the price above the moving average lines. On June 25 uptrend, MANA reached the high of $1.04 but was repelled. It fell to the low of $0.81 as bulls bought the dips. Today, the altcoin is trading at $0.97 and fluctuating below the overhead resistance. It is at level 57 of the Relative Strength Index for period 14. It indicates that MANA is in the bullish trend zone and capable of further upward.
APE /USD Major Trend: Bullish
ApeCoin’s (APE) price has resumed its upward move as price breaks above the moving average lines. The cryptocurrency has rallied to the high of $6.50 as it approaches the overbought region of the market. The bulls are retesting the resistance level to break above it.
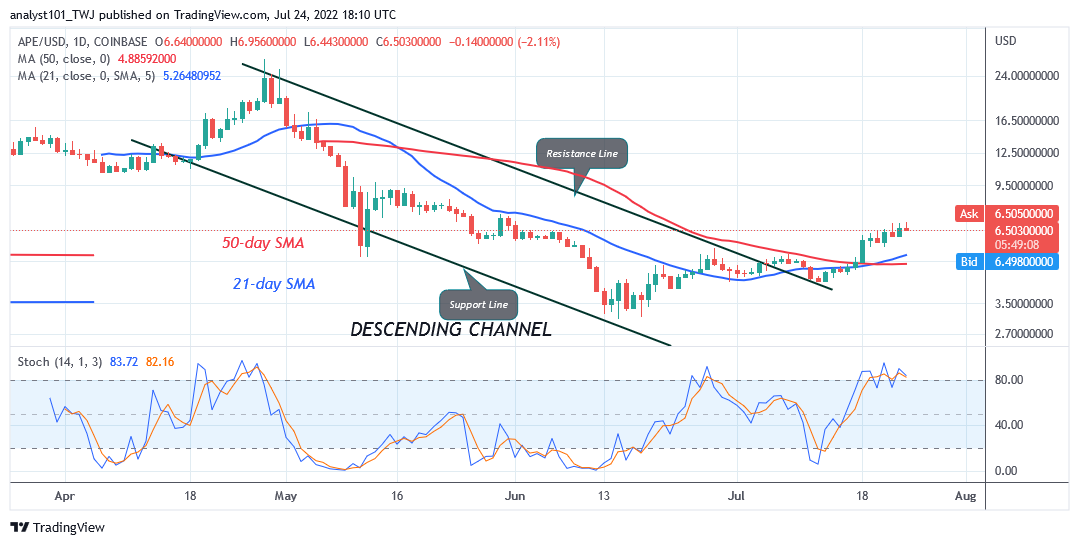
In previous price action, the altcoin was repelled at the same resistance level on June 7. APE coin declined to the low of $3.05 as bulls bought the dips. Meanwhile, the altcoin is above the 80% range of the daily stochastic. It indicates that the market has reached the overbought region. Sellers will emerge in the overbought region to push prices down. Further upward move is doubtful as the market reaches the overbought region.
ENJ /USD Major Trend: Bullish
Enjin Coin (ENJ) is trading in the bullish trend zone as price breaks above the moving average lines. On July 18, the altcoin rebounded above the $0.50 support as it rallied to the high of $0.68. The upward moves are being restricted by the $0.70 high. The cryptocurrency is in the sideways moves above the moving average lines.
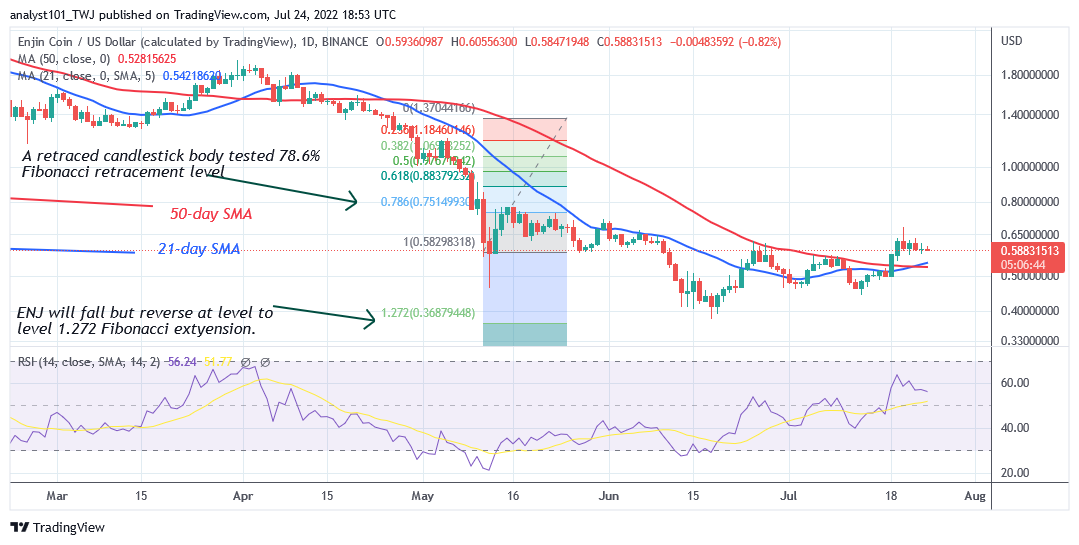
There is a tendency for a further upward movement of the Enjin Coin as it fluctuates in the bullish trend zone. In the meantime, the market is declining above the moving average lines. The uptrend will resume if price finds support above the moving average lines. The downtrend will resume if price breaks below the moving average lines. The altcoin is at level 56 of the Relative Strength Index for period 14. It indicates that it is in the bullish trend zone and capable of further upward.


