
This week the cryptocurrencies have witnessed sharp selling with Bitcoin (BTC) and most altcoins as the cryptos fell to the oversold regions of the market. The recent decline has subsided as buyers emerge in the oversold region. Let us discuss in detail the cryptos in detail.
BTC/USD Major Trend: Bearish
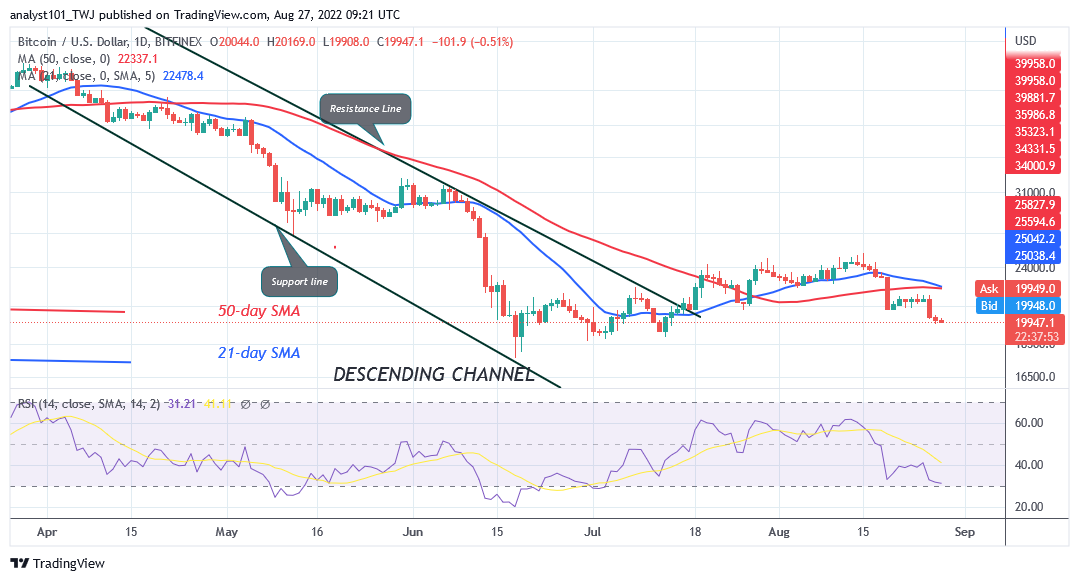
Bitcoin’s (BTC) price is in a downtrend zone as it reaches the low of $19,958. Sellers have broken the current support at $20,790. The largest cryptocurrency is likely to further decline and revisit the previous low at $17,605. On June 18 downtrend, Bitcoin declined to the low of $17,605 as bulls bought the dips. The cryptocurrency regained bullish momentum as Bitcoin rallied to the high of $24,000. Nonetheless, the current downtrend has broken below the $20,000 psychological price level indicating further downward movement of prices.
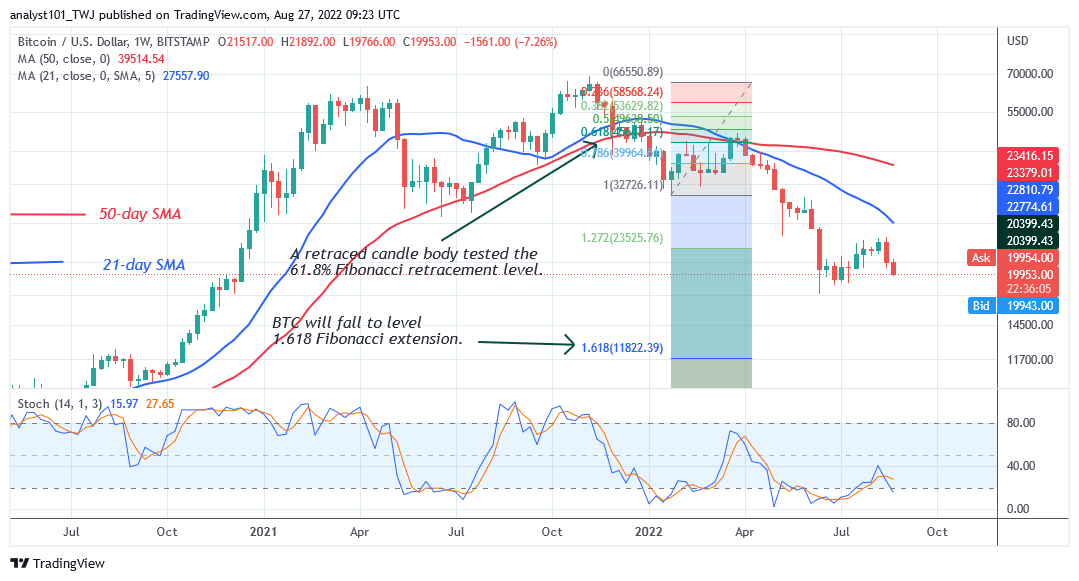
The Fibonacci tool has also indicated further decline of Bitcoin. On a weekly chart, a retraced candle body almost tested the 61.8% Fibonacci retracement level on March 28. The retracement shows that BTC will fall to level 1.618 Fibonacci extension or level $11,822.39. Bitcoin is at level 31 of the Relative Strength Index for period 14. It indicates that Bitcoin is in the bearish trend zone as it reaches the oversold region. The selling pressure may subside as buyers emerge in the oversold region.
SAND/USD Major Trend: Bearish
The Sandbox (SAND) price has continued its downward move as it fell to the low of $0.94 and resumed consolidation above the current support.
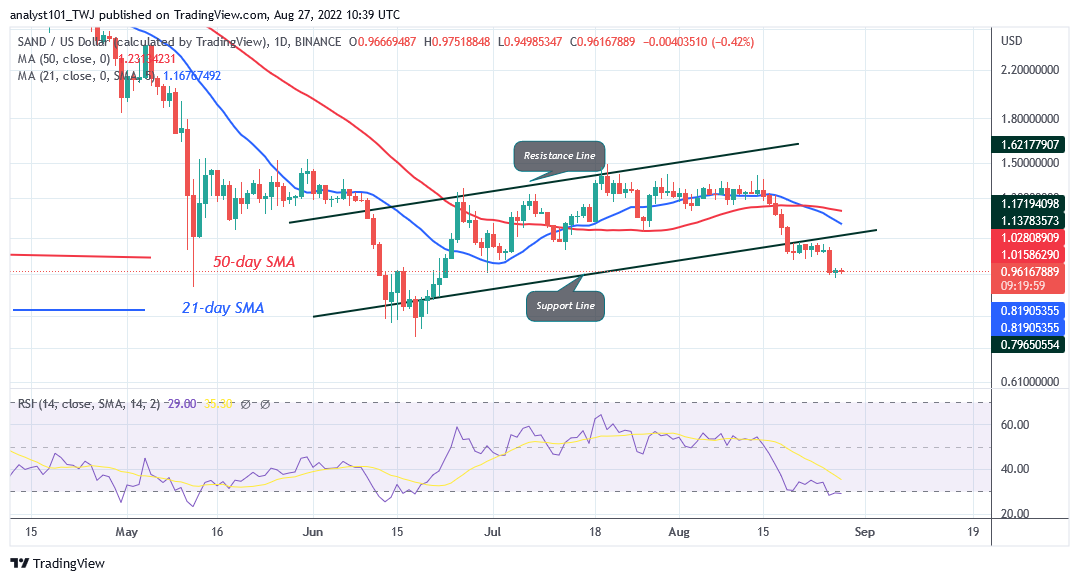
Sellers intend to push the cryptocurrency to the previous low at $0.73. In August, the upward correction was stalled at the $1.40 resistance zone. The cryptocurrency was repelled as the altcoin declined below the moving average lines. Further downward move of the coin is doubtful as the market reaches the oversold region. Meanwhile, SAND is at level 29 of the Relative Strength Index for period 14. It indicates that SAND has reached the oversold region of the market. The selling pressure is likely to subside as buyers emerge in the oversold region.
MANA/USD Major Trend: Bearish
Decentraland (MANA) price is in a downtrend as it declined to the low of $0.76 and resumed consolidation above it. Since August 17, the cryptocurrency has been trading in the oversold region of the market.
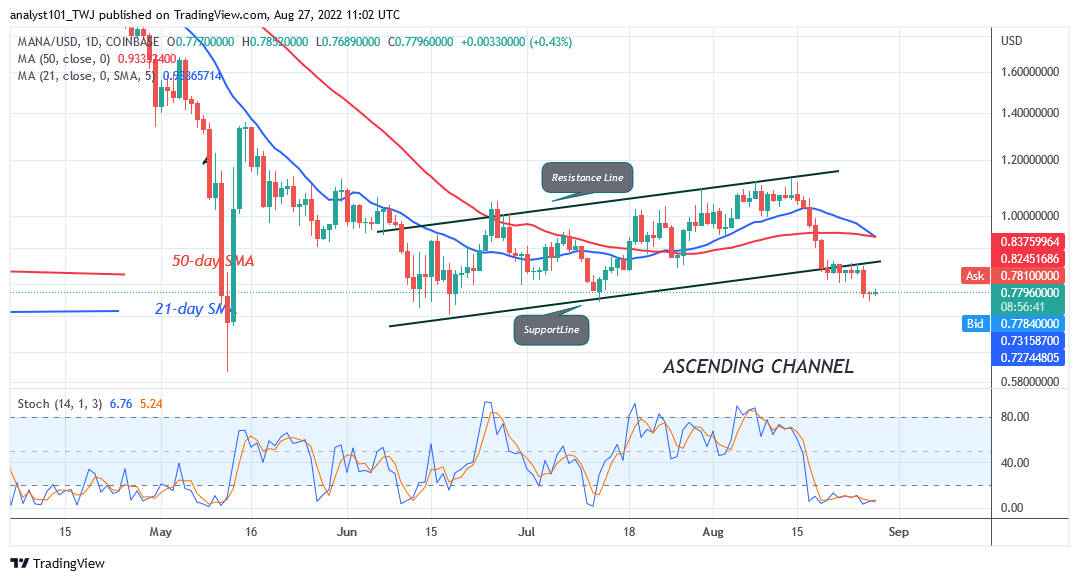
The altcoin has fallen to the previous lows of June and July price levels. MANA is below the 20% range of the daily stochastic. It indicates that the market has reached the oversold region. The selling pressure has reached bearish exhaustion as buyers emerge in the oversold region of the market. The current support levels show candlesticks with long tails. The candlesticks with long tail indicate that there is strong buying pressure at lower levels of price levels.
APE /USD Major Trend: Bearish
ApeCoin’s (APE) price is in a downtrend as it fell to the low of $4.65 and resumed consolidation. The crypto’s uptrend has been terminated as price breaks below the moving average lines.
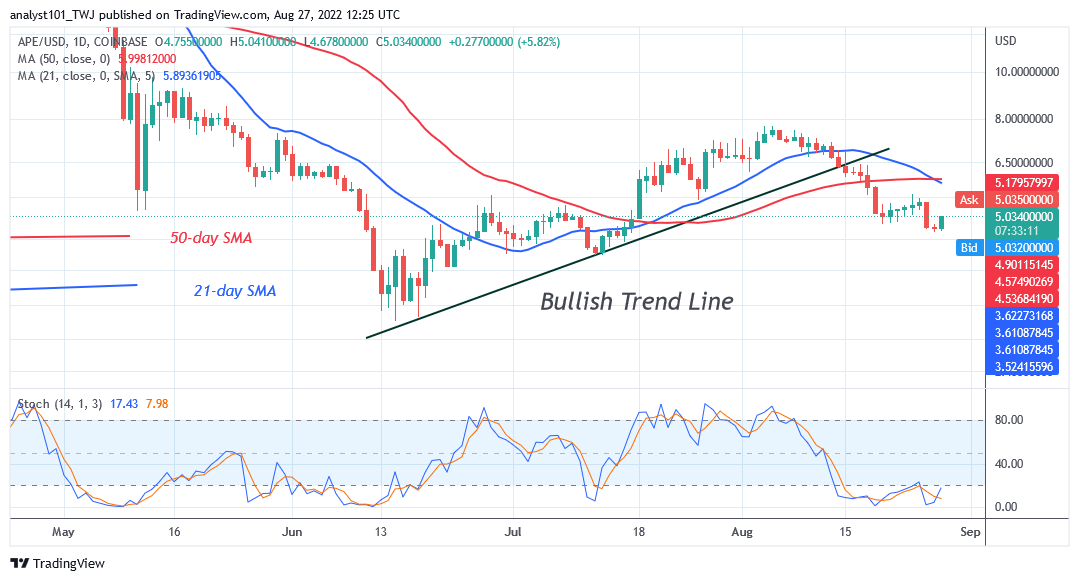
Buyers could not sustain the bullish trend above the $8 resistance zone. Besides, the coin reached the overbought region of the market. ApeCoin is below 20% range of the daily Stochastic. The altcoin has reached the overbought region of the market. The coin will soon resume upward move as buyers emerge in the oversold region.
ENJ /USD Major Trend: Bearish
Enjin Coin (ENJ) price is in a downtrend and has declined to the low of $0.50. The cryptocurrency was earlier in an uptrend but was terminated at the $0.70 high.
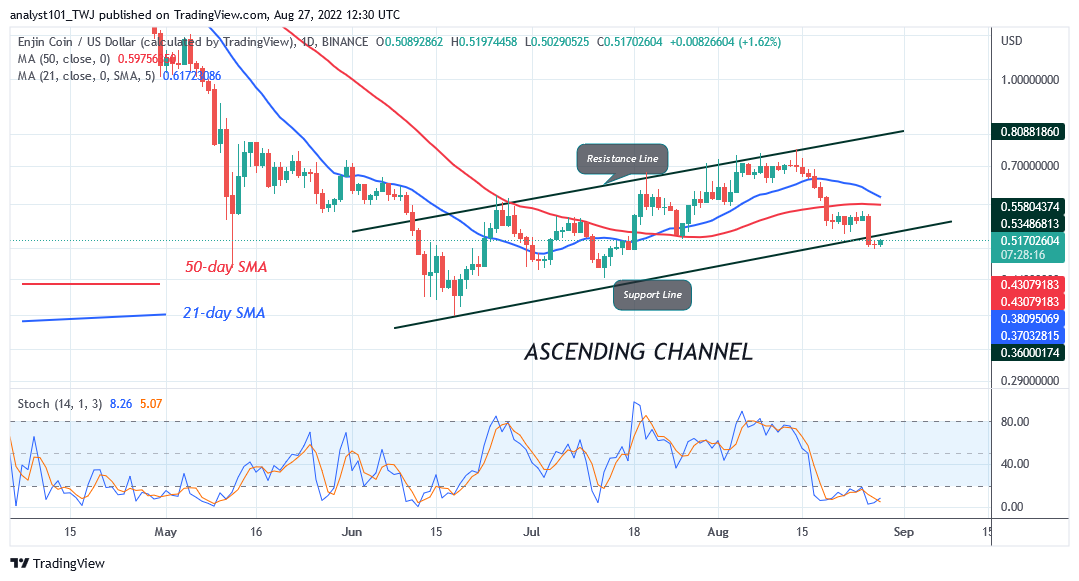
The bears break below the moving average lines signaling the resumption of downtrend. The coin has fallen to the oversold region of the market. Further selling pressure is unlikely as the market reaches the oversold region. Enjin Coin is below 20% range of the daily stochastic. Buyers will be attracted at the lower level of price.


