
Bitcoin and the altcoins are in a downtrend as the cryptos risk further decline. Presently, the cryptos have continued to be in a range-bound move above their current support levels. Nonetheless, buyers have defended current support as the altcoins corrected upward. The cryptocurrencies will trend when the range-bound levels are breached. Let us discuss the cryptos in detail.
BTC/USD Major Trend: Bearish
Bitcoin’s (BTC) price is in a downtrend but has resumed a range-bound move in a confined range. Since the August 28 price slump, the cryptocurrency has been fluctuating between $19,540 and $20,500 price levels.
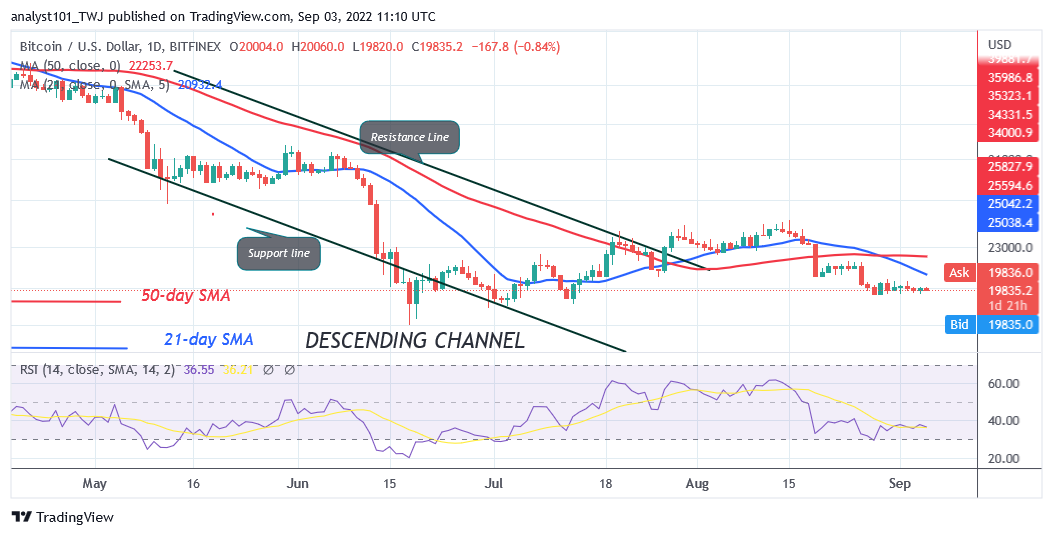
The cryptocurrency has been trading marginally because of the presence of small body indecisive candlesticks called Doji and Spinning tops. Nonetheless, if sellers breach the $19,540 support, Bitcoin will decline to the previous low at $18,912 or $18,638 price level. The bearish momentum will further extend to the low of $17,605 low. Conversely, if buyers keep the price above the initial resistance at $20,500 and $21,000, Bitcoin will regain bullish momentum.
The cryptocurrency will rally above the moving average lines. The bullish momentum will extend to the $24,000 overhead resistance levels. Bitcoin is at level 37 of the Relative Strength Index for period 14. It indicates that Bitcoin is in the bearish trend zone but approaches the oversold region.
SAND/USD Major Trend: Bearish
The Sandbox (SAND) price is in a downtrend as it fluctuates above the $0.94 support since August 26. The crypto is making an upward correction as it approaches the moving average lines.
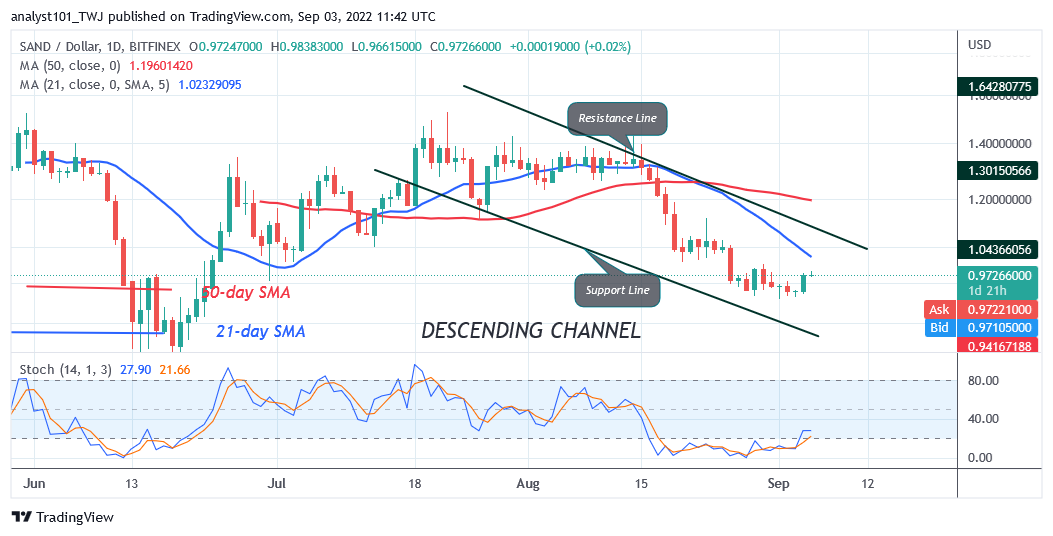
On the upside, if price breaks above the moving average lines, the altcoin will rally and retest the overhead resistance at $1.40. However, if the altcoin turns down from the moving average lines, it will decline to the previous low at $0.94. The downtrend will resume if price breaks below the $0.94 support. Meanwhile, SAND is below the 20% range of the daily stochastic. It indicates that it has reached the oversold region of the market. Buyers will emerge in the oversold region to push prices upward.
MANA/USD Major Trend: Bearish
Decentraland (MANA) price is a downtrend as price makes an upward correction. The upward correction is facing rejection at the 21-day line SMA.
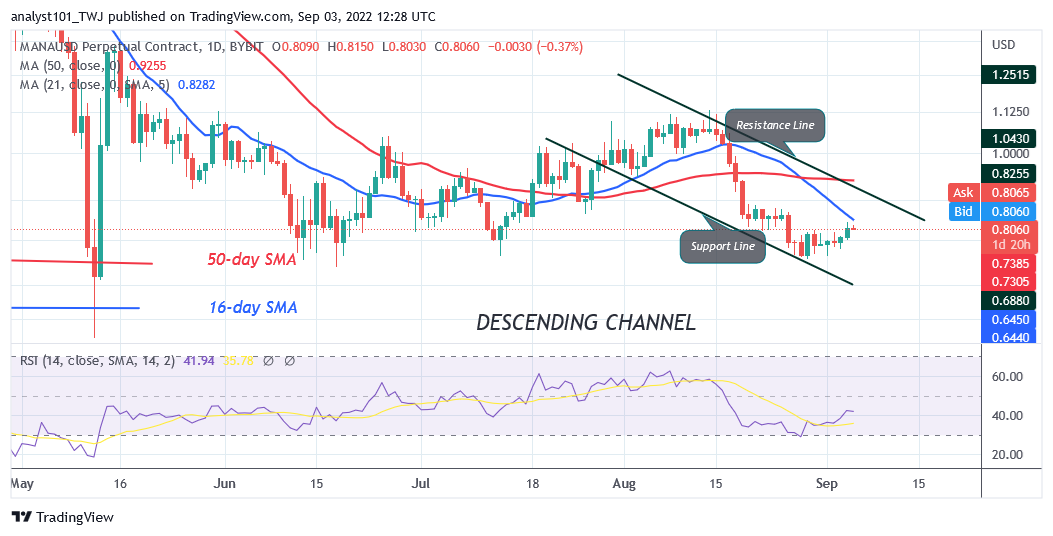
The implication is that MANA will decline to the previous low at $0.74. The coin will resume a downtrend if the bears break below the current support. Nonetheless, the altcoin will be compelled to a range-bound move between $0.74 and $0.82 if the current support holds. MANA is at level 42 of the Relative Strength Index for period 14. It indicates that it is in the downtrend zone and may further decline.
APE /USD Major Trend: Bearish
ApeCoin’s (APE) price is in a downtrend but has been in a range-bound move after the August 28 price slump. The coin fell to the low of $4.61 and commenced a range-bound move.
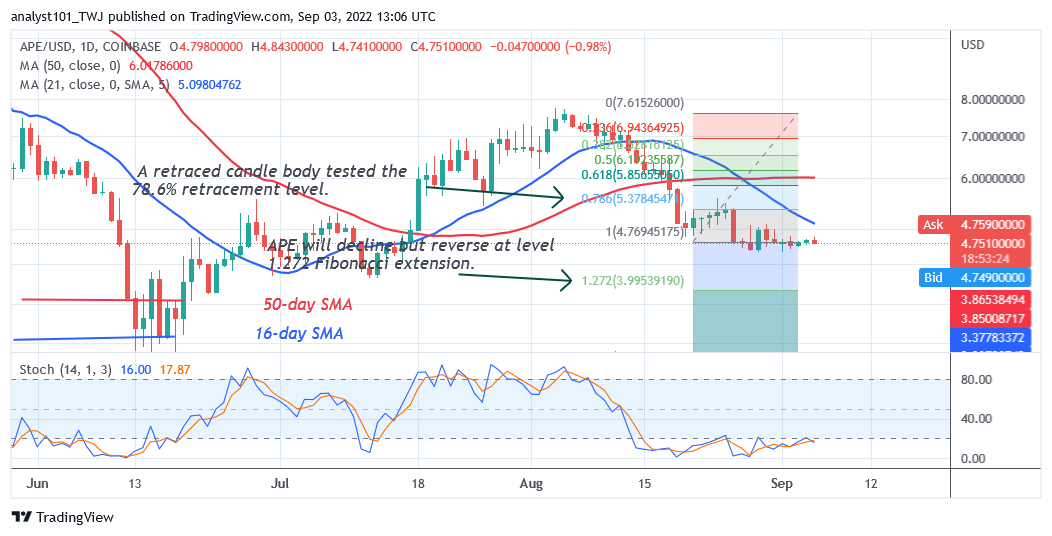
Meanwhile, on the August 21 downtrend; a retraced candle body tested the 78.6% retracement level. The retracement suggests that APE will decline but reverse at level 1.272 Fibonacci extension or $3.99. ApeCoin is below the 20% range of the daily Stochastic. The altcoin has reached the oversold region of the market. Buyers will emerge in the oversold region to push prices upward.
ENJ /USD Major Trend: Bearish
Enjin Coin (ENJ) price is in a downtrend as it resumes an upward correction. The crypto’s price was earlier making a series of lower highs and lower lows.
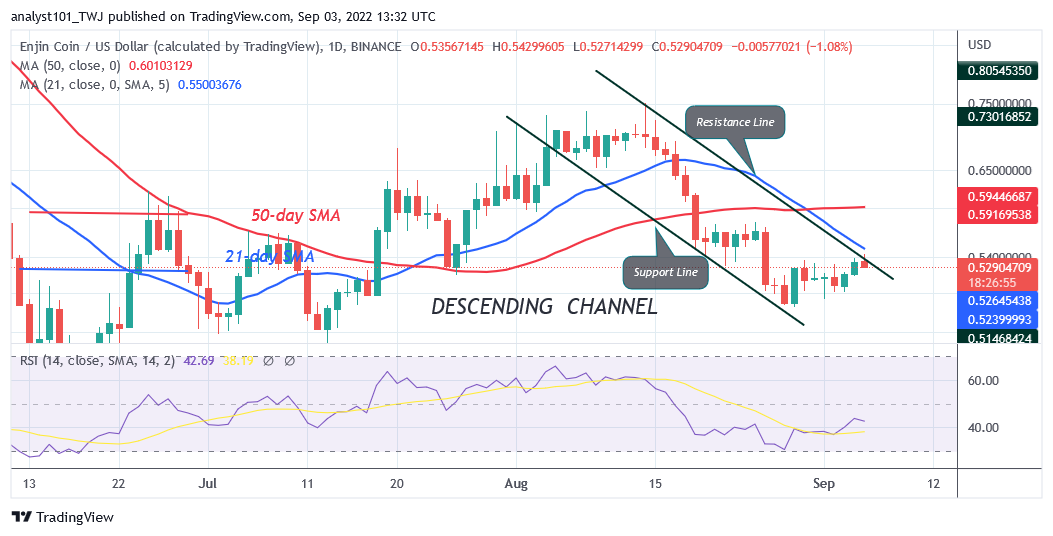
Today, the upward correction is facing rejection at the 21-day line SMA. Since August 28, the crypto has been fluctuating between $0.48 and $0.54 price levels. Buyers have retested the recent high twice but were repelled. The altcoin will trend when the range-bound levels are breached. ENJ is at level 42 of the Relative Strength Index for period 14. It indicates that it is in the downtrend zone and may further decline.


