
Bitcoin bulls have successfully defended the $48,000 support level but failed to sustain the bullish momentum above the $49,500 and $50,000 resistance levels. BTC price is likely to resume a downward correction between $48,000 and $49,500. Since August 16, Ripple and the other altcoins have failed to break above the recent highs as the cryptos resume downward correction.
BTC/USD Major Trend: Bullish
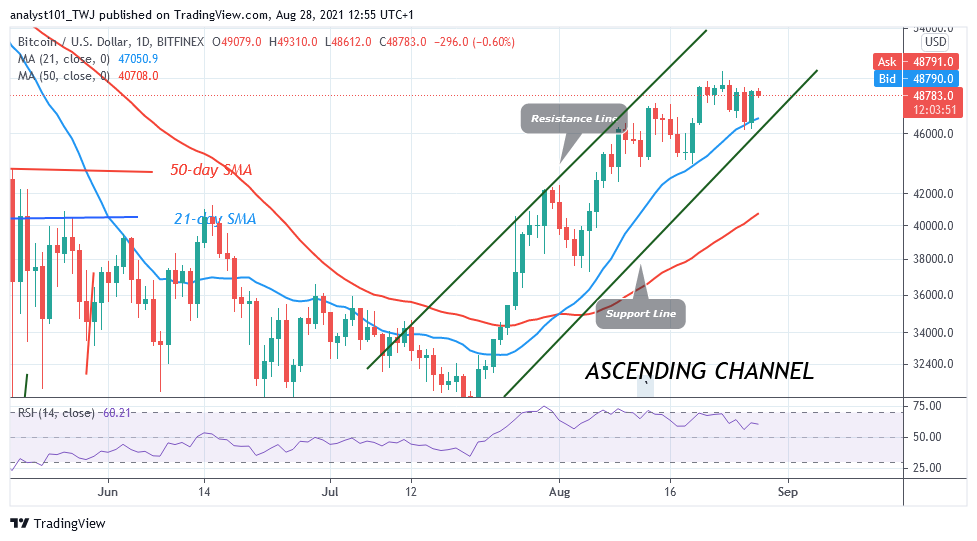
Today, BTC price has retested the $49,000 resistance twice but was repelled. The market reached the highs of $49,310 and $49,210 but was resisted. BTC price has resumed a downward move. Bitcoin is likely to decline to the low of $48,000. The market will resume upside momentum if the $48,000 support holds. If price retraces and breaks below the $48,000 support, the bears will take the advantage to sink BTC price on the downside. If the bears are successful, Bitcoin will decline to the low of $46,600 low.
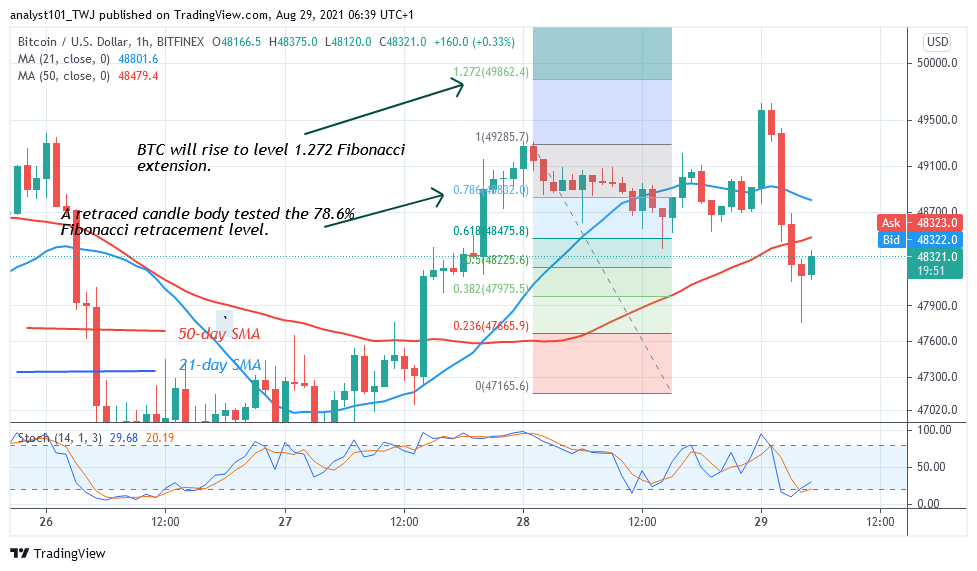
The bearish momentum will extend to the low of the breakout level of $42,000 low. In the meantime, BTC’s price is hovering and trading above the $48,000 support. Meanwhile, on August 28 uptrend; a retraced candle body tested the 78.6% Fibonacci retracement level. The retracement indicates that the BTC price will rise but reverse at level 1.272 Fibonacci extension or level $49,862.40.
XRP/USD Major Trend: Bullish
Ripple’s (XRP) price has fallen to the low of $1.07. Today, the altcoin is trading at $1.14 as the altcoin resumes upward. In August, the altcoin rallied to the high of $1.30 on three occasions. Buyers could not sustain the bullish momentum above the $1.30 high. Consequently, XRP price plunged to the breakout level of $1.07 as bulls bought the dips.
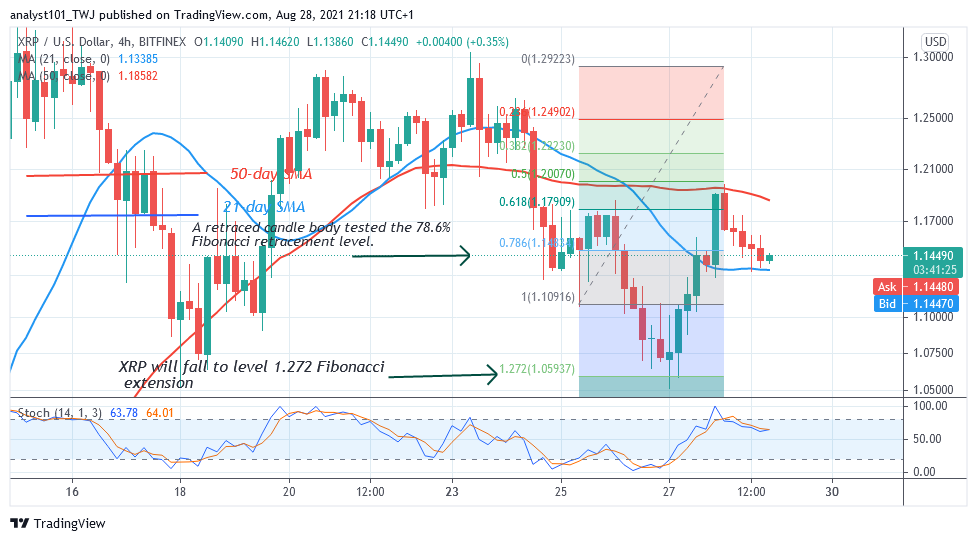
Buyers attempted to push the altcoin to the high of $1.19. The upward move is facing rejection as price finds support above the 21-day SMA. On the upside, if price breaks above the $1.21 resistance, XRP will resume an uptrend and retest the $1.30 high. Meanwhile, on August 25 downtrend; a retraced candle body tested the 78.6% Fibonacci retracement level. The retracement indicates that Ripple is likely to fall to level 1.272 Fibonacci extension or level $1.05. From the price action, XRP has reversed at level 1.272 Fibonacci extension and resumed the uptrend.
DOT/USD Major Trend: Bullish
Today, Polkadot’s (DOT) price is falling as it faces resistance from the $27.50 high. For the past week, the altcoin has been in a downward move from its peak price of $29.35. Polkadot declined to the low of $23.47 as bulls bought the dips. This propelled the altcoin to resume upward to the high of $26.76.
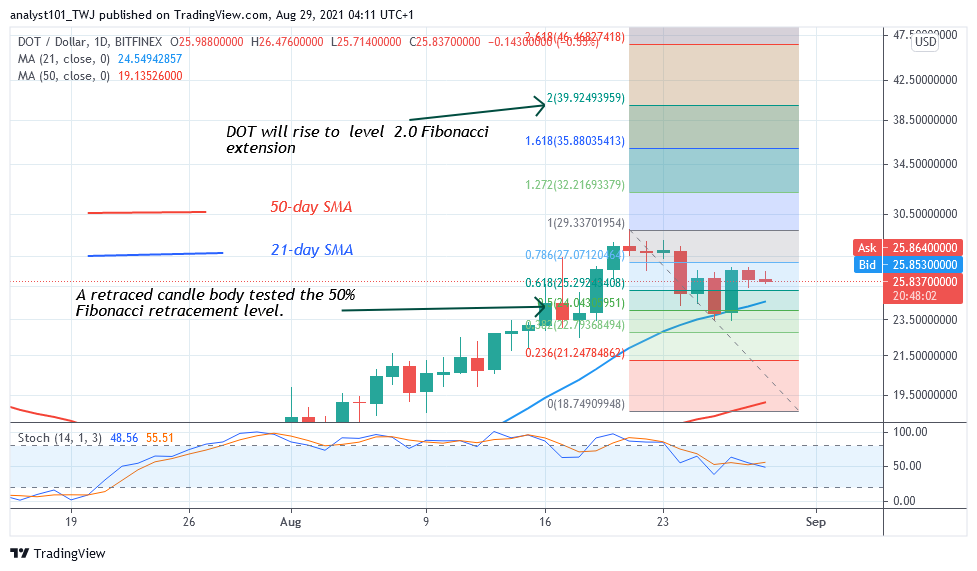
The bullish momentum could not break the $27.50 resistance. On the upside, if the bulls break the recent high, the market will rally above $35. Today, the DOT price is facing another rejection at the $27.50 resistance zone. Meanwhile, on August 21 uptrend; a retraced candle body tested the 50% Fibonacci retracement level. This retracement indicates that the market will rise to level 2.0 Fibonacci extensions or level $39.92.
LTC /USD Major Trend: Bullish
Since August 16, Litecoin’s (LTC) price has been struggling to break above the $189 resistance level. For the past two weeks, LTC/USD has been in a downward correction. The market has been fluctuating between $160 and $190.
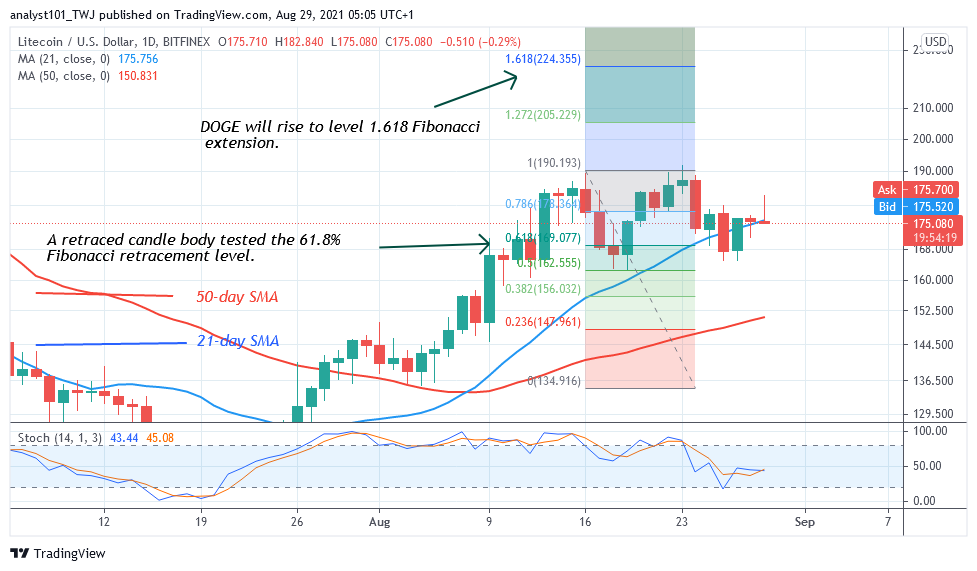
Today, the LTC price is trading at $176.65 as buyers attempt to push price upward. On the upside, if buyers break above the $189 resistance, the uptrend will commence. Litecoin will rise to $230 high. However, if the resistance remained unbroken, the downward correction will linger on. On the August 16 uptrend, a retraced candle body tested the 61.8% Fibonacci retracement level. The retracement indicates that LTC will rise to level 1.618 Fibonacci extension or level $224.35.
LINK /USD Major Trend: Bullish
Following the rally on August 16, Chainlink’s (LINK) reached a high of $30. The recent high attracted sellers as the uptrend was terminated.
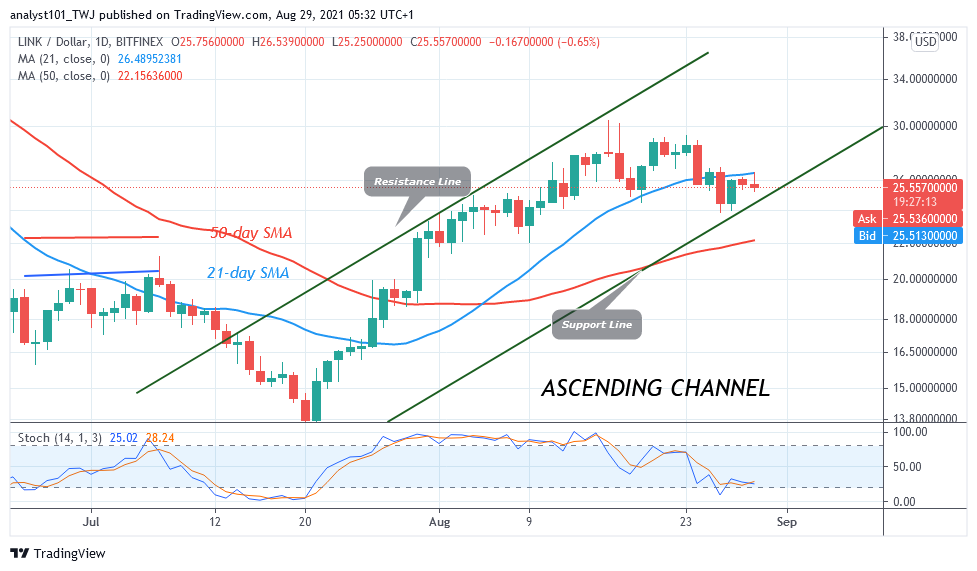
The altcoin resumed a sideways move. LINK price has been in downward correction between $24 and $30. Today, the altcoin is falling and has reached the low of $25.25. On the downside, if the bears break below the current support, the market will decline to $22 low. Chainlink will rise if the bulls break above the overhead resistance at $30. The market will rally above $35.


