
Bitcoin and the altcoins are trading in the bullish trend zone and have the advantage of further upward moves. However, the uptrend may face rejection at the overhead resistance levels. On the upside, a break above the resistance will catapult the coins to resume upside momentum.
BTC/USD Major Trend: Bullish
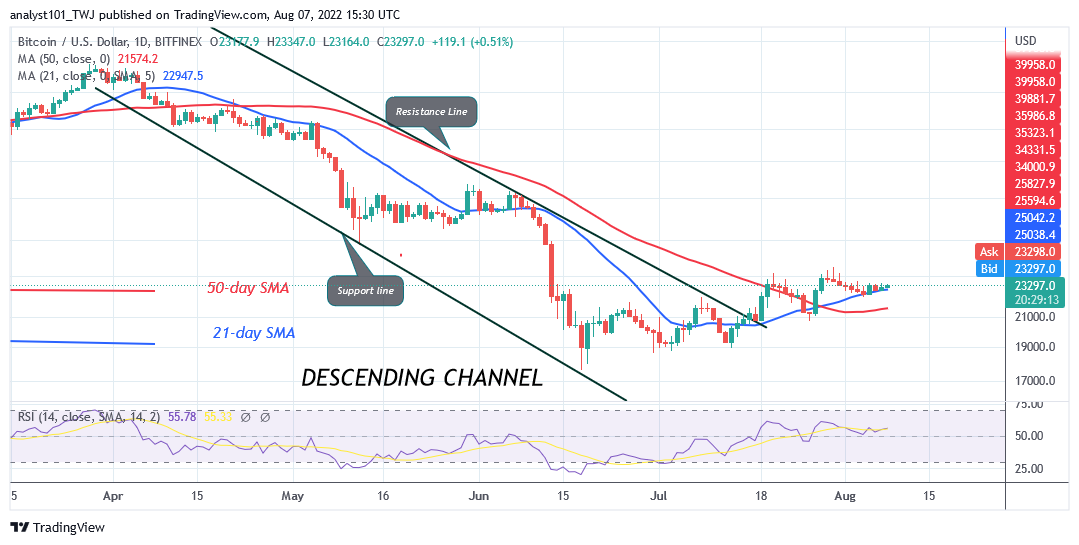
Since August 4, Bitcoin’s (BTC) price has declined and found support above the moving average lines. On July 19, the Bitcoin uptrend has been hindered at the $24,000 resistance zone. The largest cryptocurrency faced rejection twice at the overhead resistance level. Today, the crypto is rising to revisit the previous highs as it reaches the high of $23,313. On the upside, if Bitcoin rises and breaks above the $24,736 resistance, the market may resume upside momentum. BTC price will rise and reach the high of $28,000.
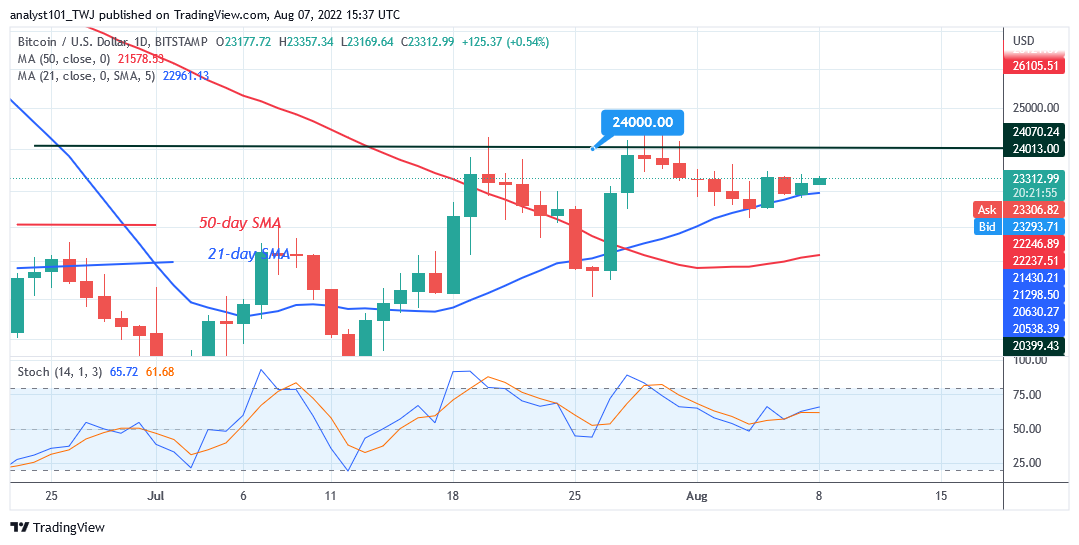
The bullish momentum will extend to the $30,000 psychological price level. However, if Bitcoin turns from the $24,000 overhead resistance, it will decline and continue its range-bound move between $22,300 and $24,700 price levels. Alternatively, if Bitcoin falls and breaks below the moving average lines, the market will decline to the low of $20, 724 support. Meanwhile, BTC’s price is at level 55 of the Relative Strength Index for period 14. It indicates that Bitcoin is in the bullish trend zone and may further rise.
SAND/USD Major Trend: Bullish
The Sandbox (SAND) price has broken above the moving average lines but has continued to face resistance at the high of $1.40 high. In previous uptrends on July 19 and 28, the bulls failed to keep the price above the $1.40 overhead resistance. The SAND was repelled as the market declined below the 21-day line SMA.
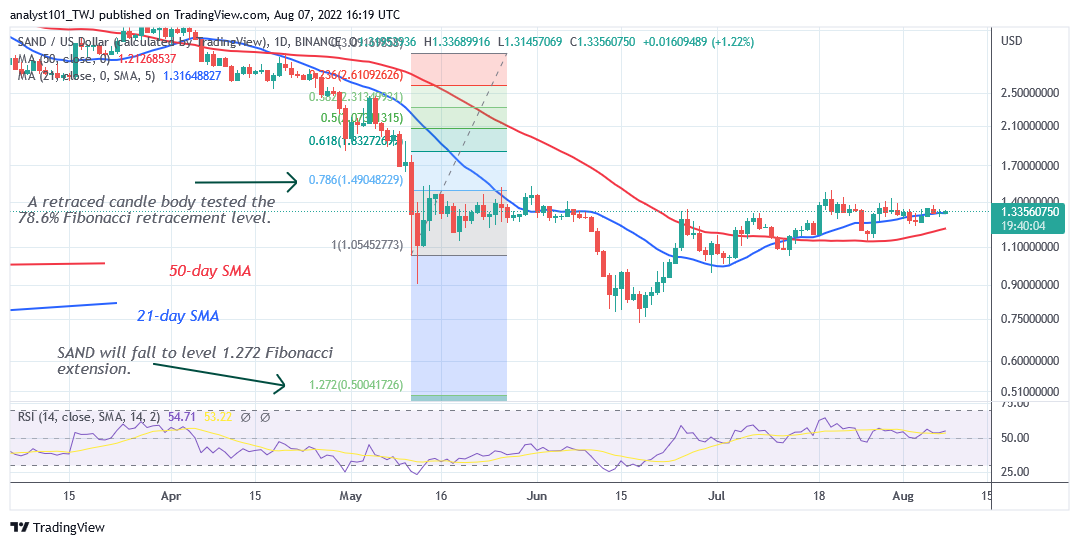
The bulls have bought the dips as the altcoin rose above the moving average lines. On the upside, if the bulls breach the resistance at $1.40 and $1.50, the SAND will rally to the high of $2.50. However, the uptrend is doubtful because of the presence of small body indecisive candlesticks called Doji. Nevertheless, if the altcoin turns from the $1.40 overhead resistance, the market will decline to the low of $1.13.Meanwhile, SAND is at level 55 of the Relative Strength Index for period 14. It indicates that it is in the bullish trend zone and may further rise.
MANA/USD Major Trend: Bullish
Decentraland (MANA) price is trading in the bullish trend zone as price breaks above the moving average lines. Since June 25, the uptrend has been hindered at the $1.04 resistance.
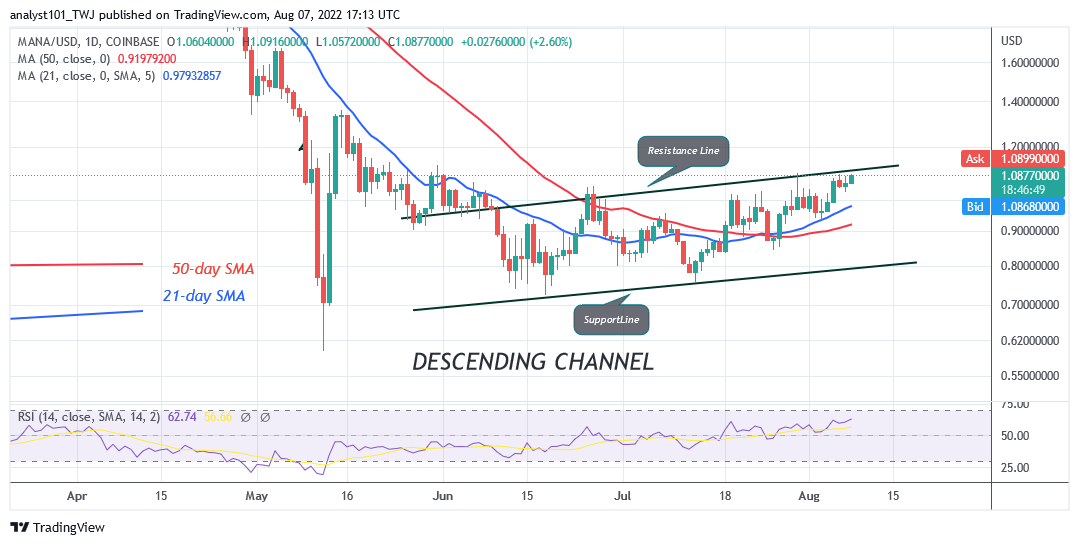
Today, buyers are attempting to push the price above the $1.00 resistance zone. MANA will reach the high of $1.36 if the bulls breach the resistance at $1.00. On the downside, MANA will decline above the moving average lines or to the low of $0.84 if MANA/USD turns from the overhead resistance zone. Meanwhile, the crypto is at level 63 of the Relative Strength Index for period 14. It indicates that it is in the bullish trend zone and may further rise.
APE /USD Major Trend: Bullish
ApeCoin’s (APE) price is in an uptrend as price makes a series of higher highs and higher lows. The coin is retesting the resistance at $7.30. On the upside, if the bulls breach the resistance at $7.30, the market will rally to the high of $10.
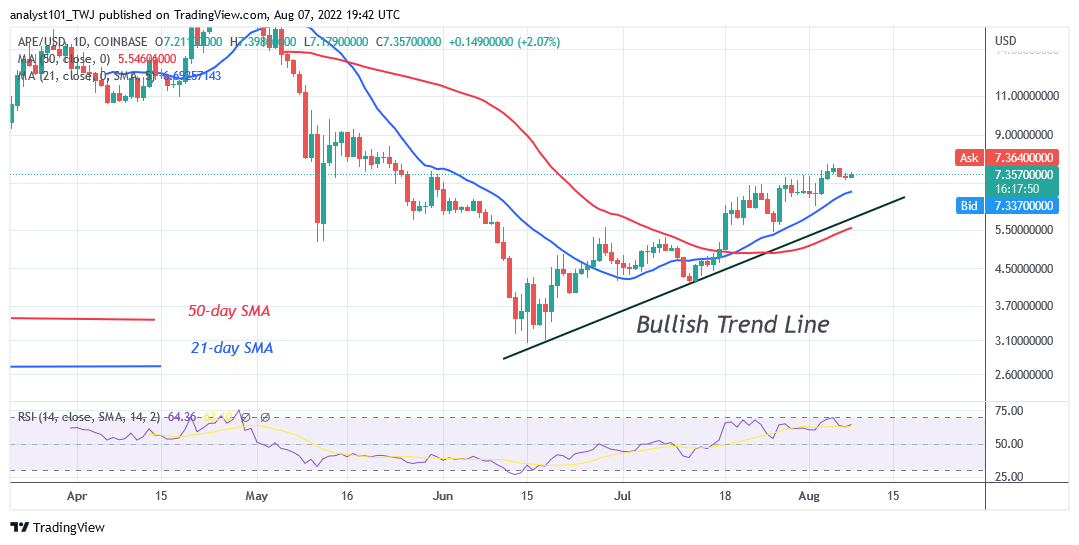
The bullish momentum will extend to the high of $16. However,a further upward move is doubtful as the price action is characterized by small body indecisive candlesticks called Doji. The selling pressure will resume if price breaks below the moving average lines. Meanwhile, APE is at level 64 of the Relative Strength Index for period 14. It indicates that APE is in the bullish trend zone and may further rise.
ENJ /USD Major Trend: Bullish
Enjin Coin (ENJ) price is in the bullish trend zone as price breaks above the moving average lines. Since August 4, buyers have been struggling to break above the resistance at $0.70.
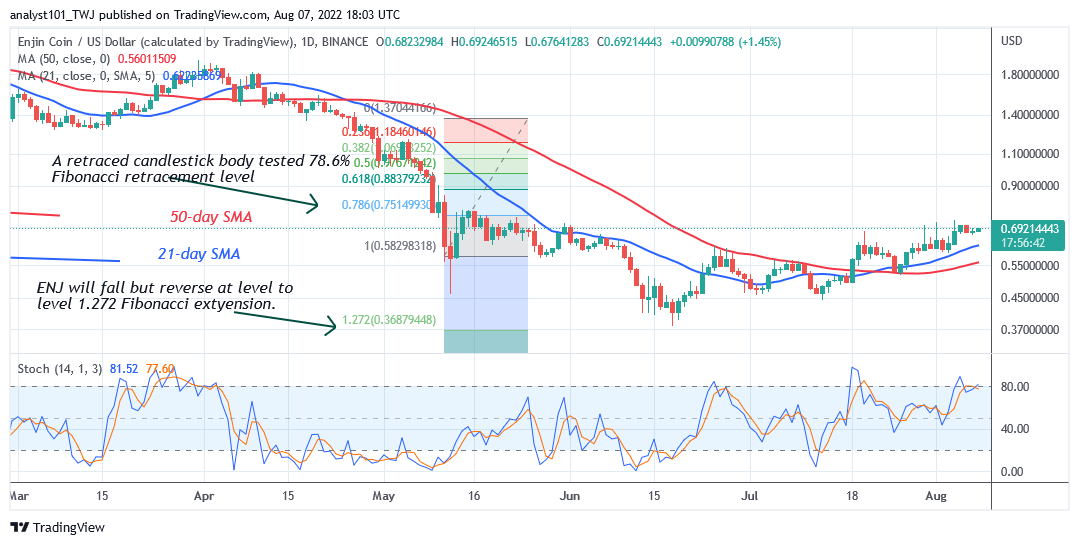
On the upside, if the bulls breach the resistance at $0.70 and $0.77, ENJ will rise to the highs of $0.90 and $1.18. However, the upward move is doubtful as the altcoin reaches the overbought region of the market. Besides, the price movement is stagnant because of the presence of small body indecisive candlesticks. On the downside, the altcoin will decline above the moving average lines if faces rejection at the recent highs. Meanwhile, ENJ is above the 80% range of the daily stochastic. It indicates that the coin is trading in the overbought region of the market.


