
Bitcoin’s (BTC) price has broken above the moving averages but has failed to break the $45,000 overhead resistance. The largest crypto has pulled back above the moving averages or $42,307 support for a possible upward. The altcoins under consideration are facing similar situations at the recent highs. However, the cryptocurrencies have fallen to the previous lows to resume a downward correction.
BTC/USD Major Trend: Bullish
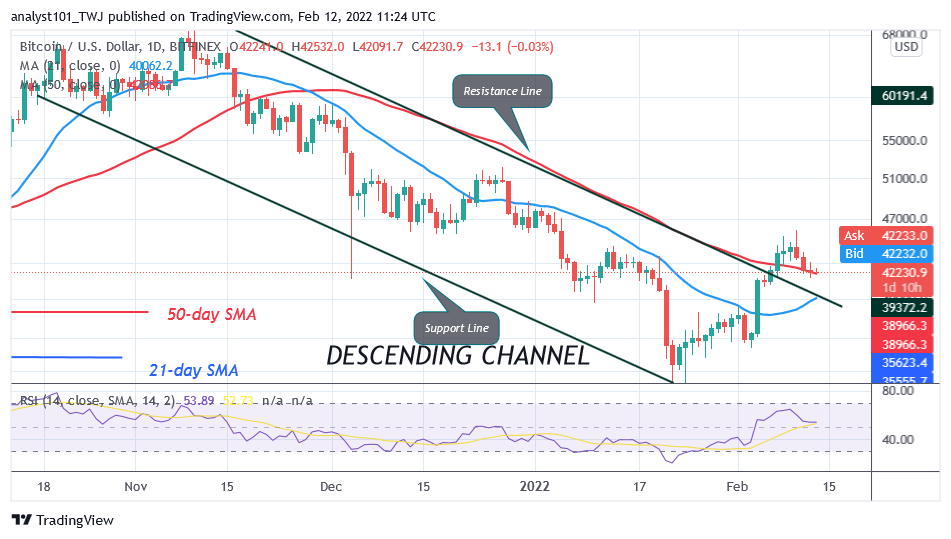
Bitcoin’s (BTC) price is in an uptrend. The bullish momentum broke above the 21-day line and the 50-day line moving averages. However, because of the rejection at the $45,000 resistance zone, BTC is likely to fall below the 50-day line moving average. If BTC price falls below the 50-day line moving average, Bitcoin will be compelled to a range-bound move between the moving averages. However, BTC price holds above the moving averages, the uptrend is likely to resume.
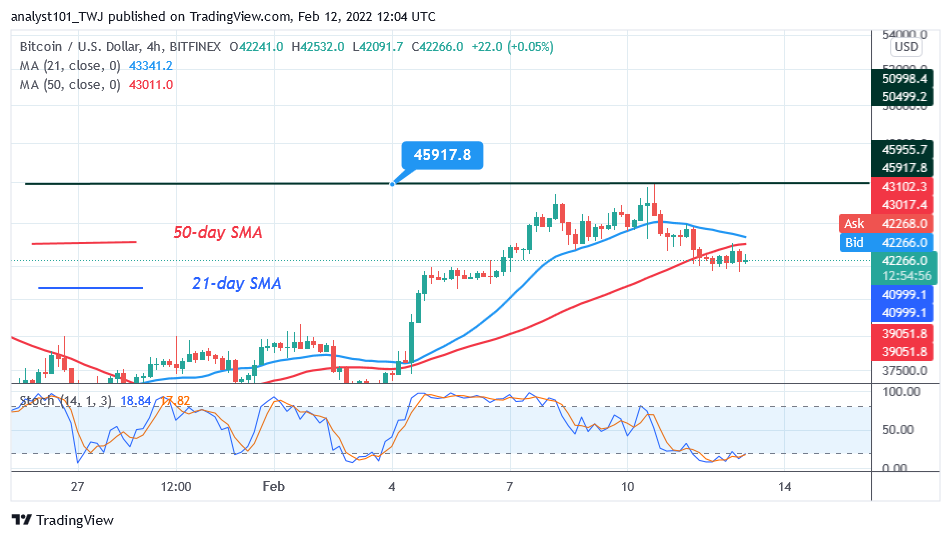
Today, BTC/USD is trading at $42,250 after the rejection at the $45,000 resistance zone. On the downside, if the BTC price breaks below the $42000 support, the cryptocurrency is likely to decline to the breakout level of $39,000. . Meanwhile, the BTC price is below the 20% range of the daily stochastic, It indicates Bitcoin has fallen to the oversold region. The selling pressure is likely to ease as buyers emerge in the oversold region.
XRP/USD Major Trend: Bullish
Ripple’s (XRP) price is in an uptrend as price breaks above the moving averages. Presently, the cryptocurrency is facing rejection at the $0.90 resistance zone. XRP has retraced and found support above the moving averages.
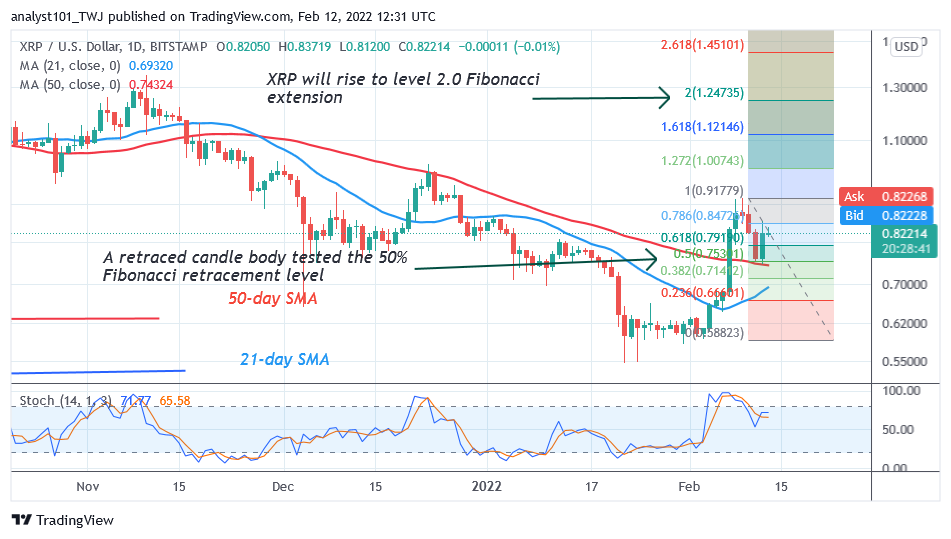
The uptrend will resume if price holds above the moving averages. However, the selling pressure will resume if price breaks below the moving averages. Meanwhile, on February 10 uptrend; a retraced candle body tested the 50% Fibonacci retracement level. The retracement suggests that XRP will rise to level 2.0 Fibonacci extension or $1.24. From the price action, XRP is holding above the moving averages. Nonetheless, the bullish scenario will be invalidated if price breaks below the moving averages.
DOT/USD Major Trend: Bearish
On the daily chart, Polkadot’s (DOT) price is in a downtrend. DOT price has fallen below the moving averages. There is a tendency for the altcoin to further decline to the downside. However, on the 4-hour chart, the downtrend has subsided as the altcoin consolidates above the $0.18 support.
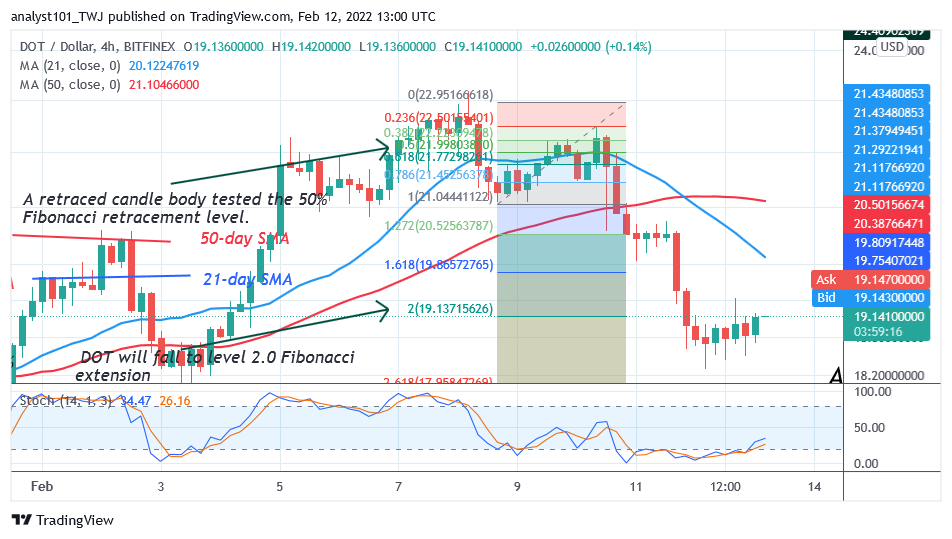
Meanwhile, on February 8 downtrend, a retraced candle body tested the 50% Fibonacci retracement level. The retracement suggests that XRP will fall to level 2.0 Fibonacci extension or $19.13. From the price action, XRP is consolidating above the 2.0 Fibonacci extension. The upward movement will depend on whether the current support holds. The market will rise and revisit the previous high of $22 as the upward move resumes.
LTC /USD Major Trend: Bullish
Litecoin’s (LTC) price is in an uptrend. On February 4, the bullish momentum broke above the moving averages. However, the bullish momentum was resisted at the $140 high. Consequently, Litecoin declined and slumped below the 50-day line moving average.
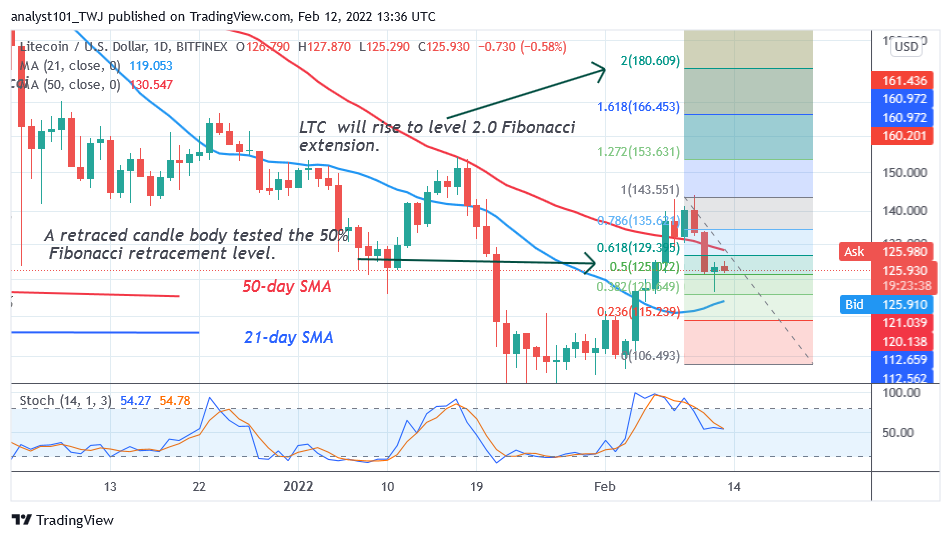
The cryptocurrency is likely to fluctuate between the moving averages. Litecoin will resume trending when the moving average lines are broken. Meanwhile, on February 9 uptrend; a retraced candle body tested the 50% Fibonacci retracement level. The retracement suggests that LTC will rise to level 2.0 Fibonacci extension or $180.60. From the price action, the LTC price has resumed an upward move above the $124 support. The Fibonacci tool analysis will hold if buyers break the $140 resistance.
LINK /USD Major Trend: Bearish
Chainlink’s (LINK) price is in a downtrend. The bears have broken below the moving averages as the altcoin reached the low of $16. The altcoin is capable of a further downward move.
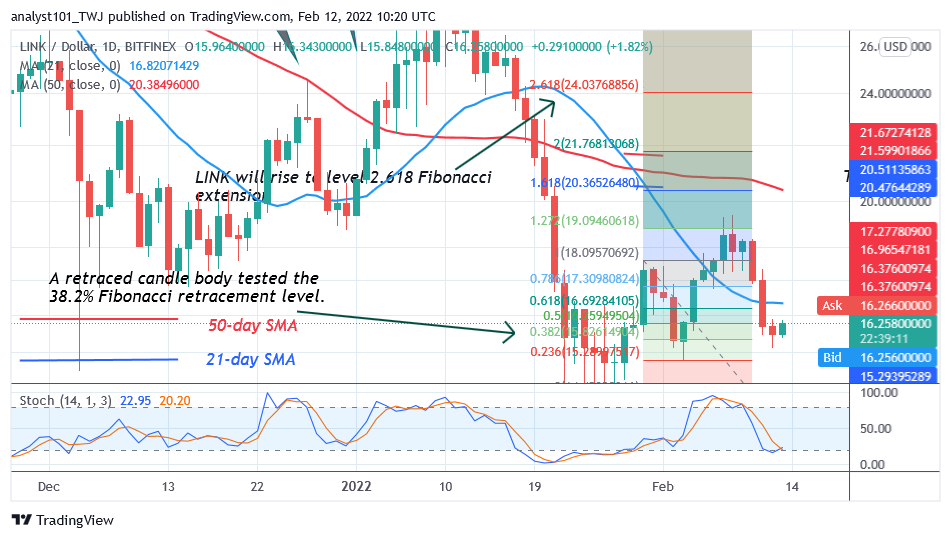
Presently, the altcoin has fallen to the oversold region of the market. Buyers are likely to push the altcoin to the previous highs. In the previous price actions, buyers have been repelled at the $18 and $19 price levels as the altcoin pulled below the 21-day line moving average. Meanwhile, on January 30 uptrend; a retraced candle body tested the 38.2% Fibonacci retracement level. The retracement suggests that LINK will rise to level 2.618 Fibonacci extension or $24.03. The Fibonacci tool analysis will hold if price breaks above the 50-day line moving average or $20 high.


