
Bitcoin’s (BTC) price and the other cryptos except for XRP are in a fresh decline as prices break below the moving averages. Bitcoin and the altcoins above have failed to break their recent highs which have resulted in further decline. The cryptocurrencies are likely to decline if the bears break the current support levels.
BTC/USD Major Trend: Bearish
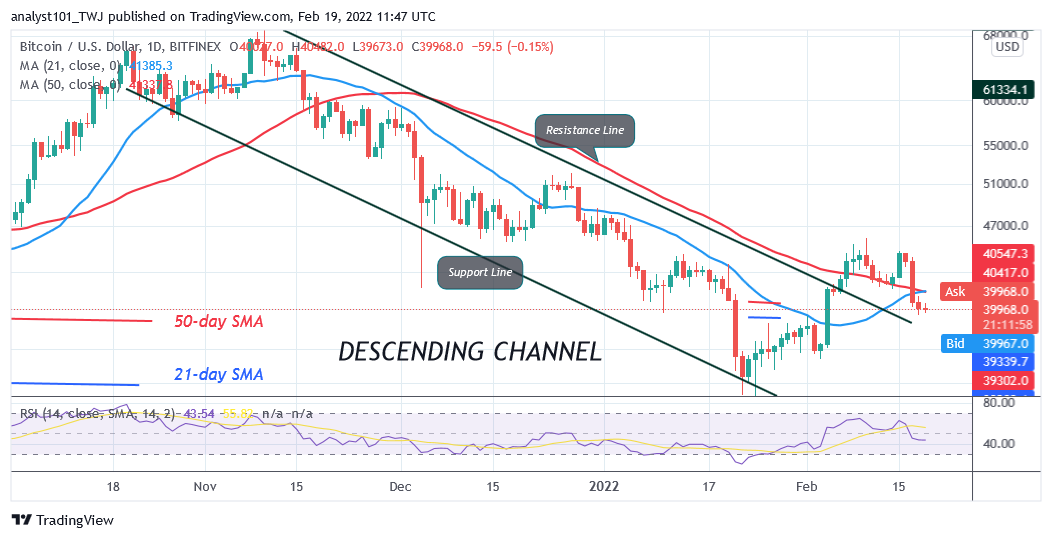
Bitcoin’s (BTC) price has fallen below the moving averages. Bitcoin dropped sharply as the bears broke below the $41,800 support. Since February 8, the bears and bulls are in price tussle as Bitcoin was range-bound between $41,800 and $45,000 price levels. Today, the bears have the upper hand as BTC/USD dropped to the breakout level of $39,600. The $39,000 support is a crucial support to watch as bulls will attempt to defend it to avoid a further decline of the cryptocurrency. On the other, the bears will attempt to sink BTC price.
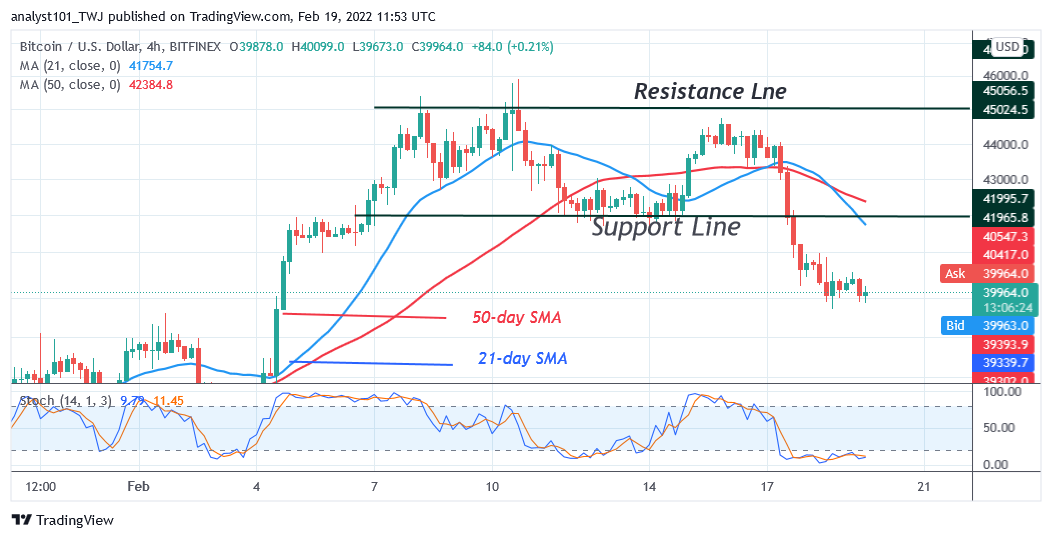
On the downside, if the bears succeed in breaking below the $39,000 support BTC’s price will drop to $36,000 low. Conversely, if the support at $39,686 holds, buyers will attempt to push the crypto above the moving averages. If they succeed, Bitcoin could gradually rally toward $45,000 overhead resistance. Today, BTC’s price is consolidating above the $39,686 support as bulls push BTC price above the $40,000 psychological price level.
XRP/USD Major Trend: Bullish
Ripple’s (XRP) price is trading in the bullish trend zone as the price breaks above the moving averages. Since February 8, the bulls have sustained recent rallies above the moving averages. For over a week, XRP/USD has been trading between the $0.75 and $0.90 price levels. Buyers have failed to keep the XRP price above the $0.90 high.
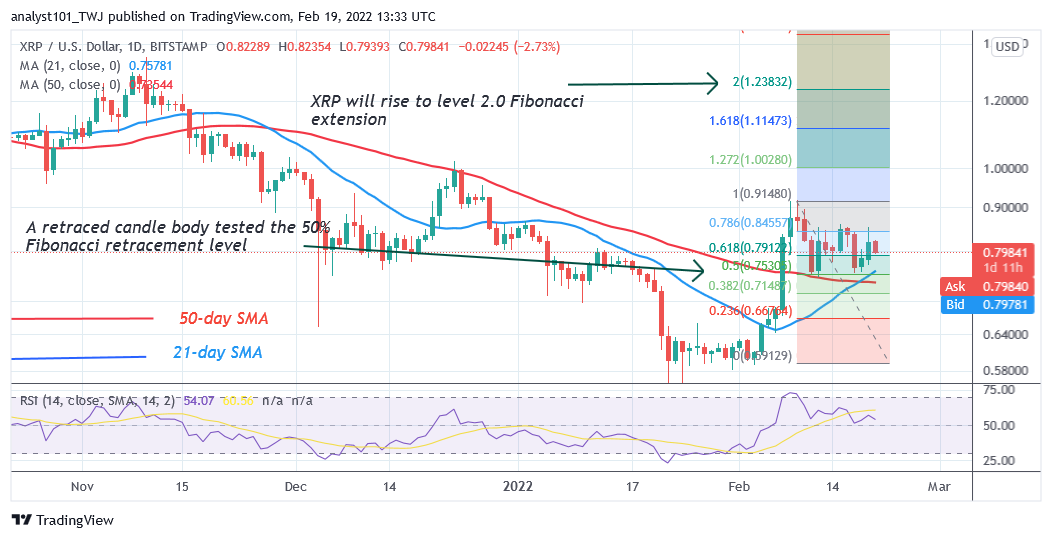
A break above the $0.90 high will propel the altcoin above the $1.00 overhead resistance. XRP will be out of downward correction. Nonetheless, buyers have failed to break the recent high but have defended the $0.75 support. Over the week, the bears found it difficult to break the current support. Meanwhile, on February 8 uptrend; a retraced candle body tested the 50% Fibonacci retracement level. The retracement suggests that XRP will rise to level 2.0 Fibonacci extension or $1.23. From the price action, XRP is confined in between the moving averages.
DOT/USD Major Trend: Bearish
Polkadot’s (DOT) price is in a downtrend as price breaks below the moving averages. On February 16, the bulls broke above the 21-day line moving average but were resisted at the $20 high.
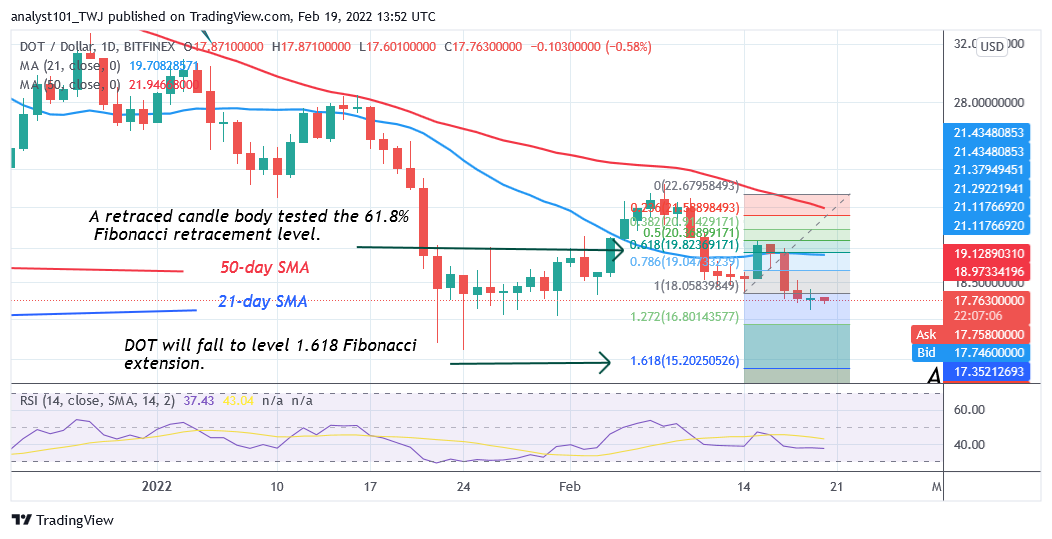
This is an indication of further downward movement of prices. Today, the cryptocurrency has fallen to the low of $17 as of press time. The bears are retesting the previous low at the bottom of the chart. The selling pressure will resume if the previous low is breached. Meanwhile, on February 14 downtrend; a retraced candle body tested the 61.8% Fibonacci retracement level. The retracement suggests that XRP will fall to level 1.618 Fibonacci extension or $15.20. From the price action, XRP has fallen to the low of $17.
LTC /USD Major Trend: Bullish
Litecoin’s (LTC) price is in a downtrend as price breaks below the moving averages. LTC price has declined to the low of $114 after the rejection at the $140 high.
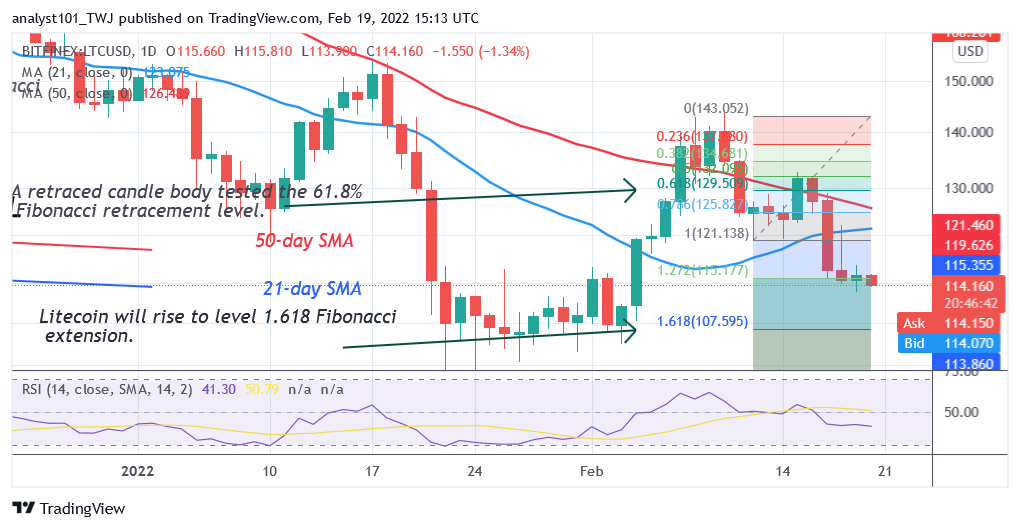
The cryptocurrency risks further decline below the moving averages. Meanwhile, on February 12 downtrend; a retraced candle body tested the 61.8% Fibonacci retracement level. The retracement suggests that LTC will fall to level 1.618 Fibonacci extension or $107.59. From the price action, the LTC price has fallen to the low of $114 and may further decline.
LINK /USD Major Trend: Bearish
Chainlink’s (LINK) price is in a downtrend as the price breaks below the moving averages. The cryptocurrency has declined to the low of $15 after the rejection at the high of $19.
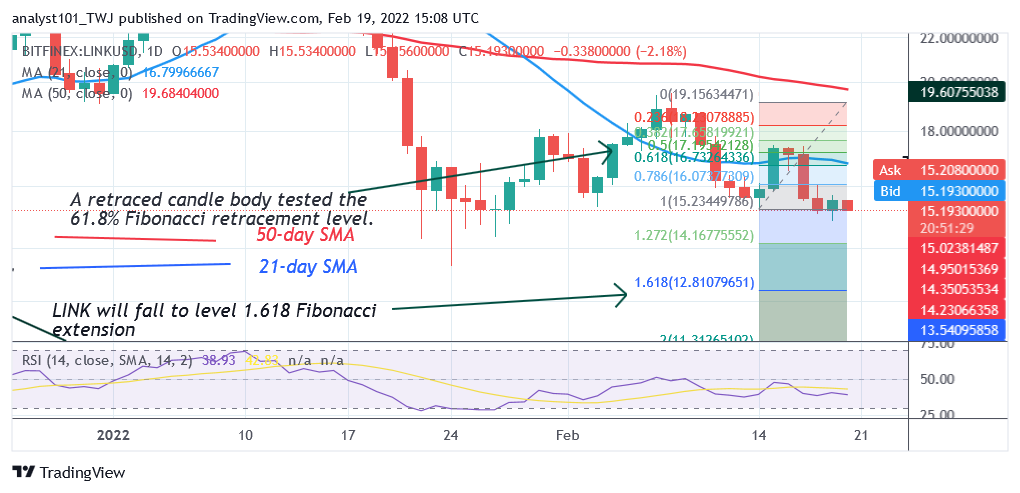
The altcoin has fallen to the previous low of the January 22 price slump. Chainlink will further decline if this current support is breached. Meanwhile, on February 14 downtrend; a retraced candle body tested the 61.8% Fibonacci retracement level. The retracement suggests that LINK will fall to level 1.618 Fibonacci extension or $12.81. From the price action, Chainlink has fallen to the low of $15.10 at the time of writing.


