
Bitcoin, the largest cryptocurrency has plunged below the $36,000 low as the crypto reaches deeper correction. From every indication, the bears will attempt to sink Bitcoin to the $30,000 psychological price level. Similarly, XRP, DOT, and LTC have fallen to their oversold regions. Bitcoin and the other cryptos are likely to face deeper correction. Let us examine each of these coins.
BTC/USD Major Trend: Bearish
Bitcoin’s (BTC) price has fallen to a deeper downward correction. The cryptocurrency plunged to $33,855 as bulls bought the dips.BTC price is making an upward correction as the market rises to $35,487 as of press time. The upward correction is likely to be short-lived as BTC price is likely to revisit the $30,000 psychological price level.
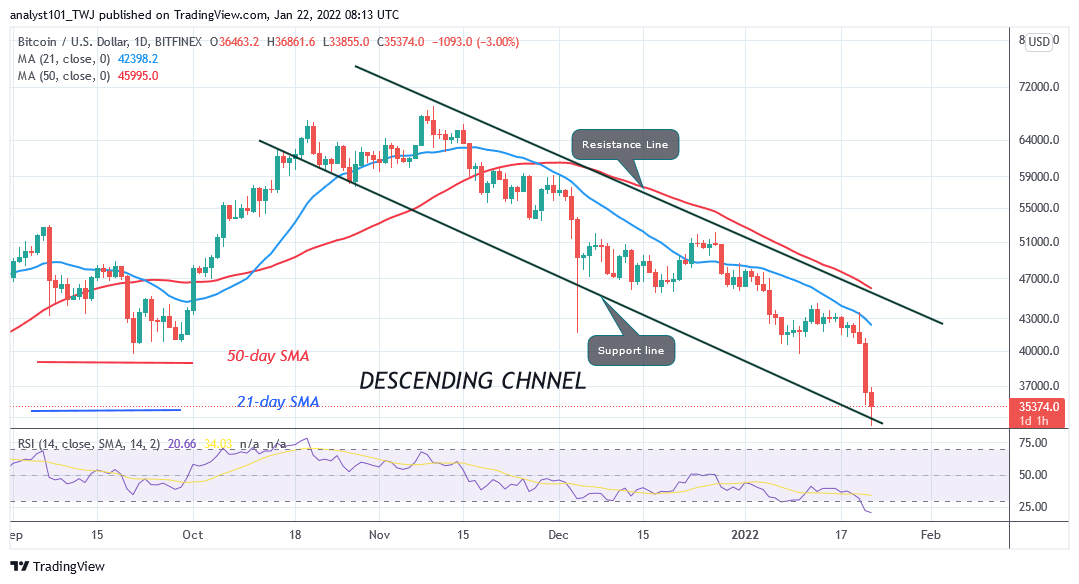
The current price level is the historical price level of June 2021. In June, BTC price was range-bound between $32,000 and $39,000 price levels. Nonetheless, the bears have the upper hand as they break below $32,000 support. This resulted in the market declining to the low of $29,313 on July 20, 2021.
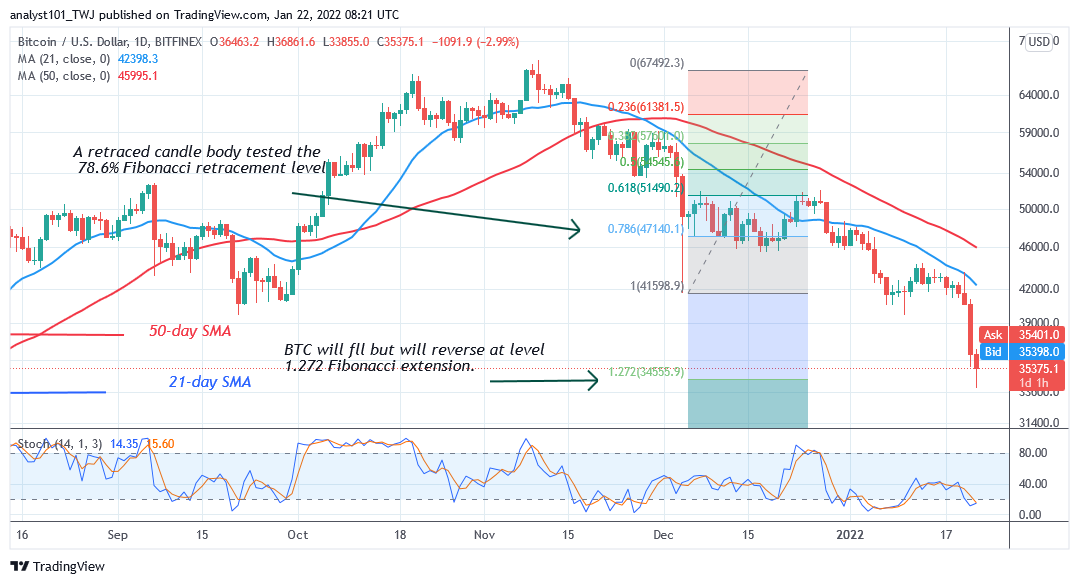
BTC’s price rebounded above the current support as bulls bought the dips. On July 20, the largest cryptocurrency rallied to the high of $52,742. Today, BTC’s price is still hovering above the $35,000 support. The uptrend will resume if the current support holds. Meanwhile, Bitcoin is at level 21 of the Relative Strength Index for Period 14. It indicates that the market has reached the oversold region. Buyers are expected to emerge in the oversold region.
XRP/USD Major Trend: Bearish
Ripple’s (XRP) price has continued its selling pressure as the price breaks below the $0.73 support. In the previous price action, XRP was range-bound between $0.73 and $0.80 price levels. During the range-bound move, buyers attempted to break the $0.80 resistance but were repelled.
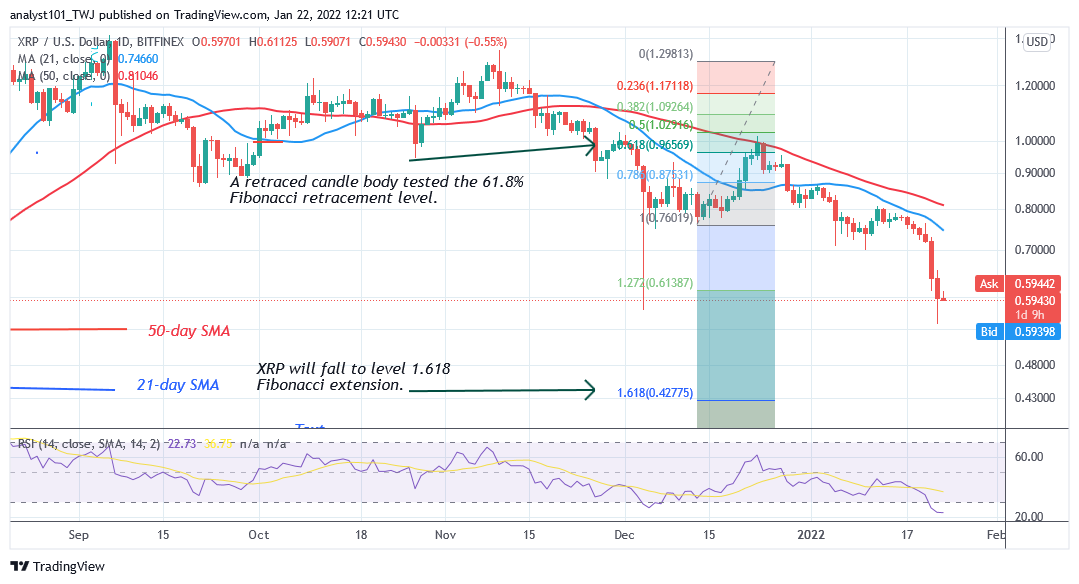
On January 20, the bears broke below the $0.73 support and resumed a downtrend. XRP has fallen and retested the previous low of $0.57. The $0.57 price level is the previous low of the December 4 price slump. The cryptocurrency will further decline if the previous low of $0.57 is breached. Nonetheless, on December 14 downtrend; a retraced candle body tested the 61.8% Fibonacci retracement level. The retracement suggests that XRP will fall to level 1.618 Fibonacci extension or $0.42. From the price action, XRP/USD has fallen to the low of $0.59 as of press time.
DOT/USD Major Trend: Bearish
Polkadot’s (DOT) price has resumed a downtrend after the recent rejection at the $28 high. On December 26 uptrend, buyers attempted to breach the $32 resistance level. The current downtrend was a result of the buyer’s failure to breach the $32 high.
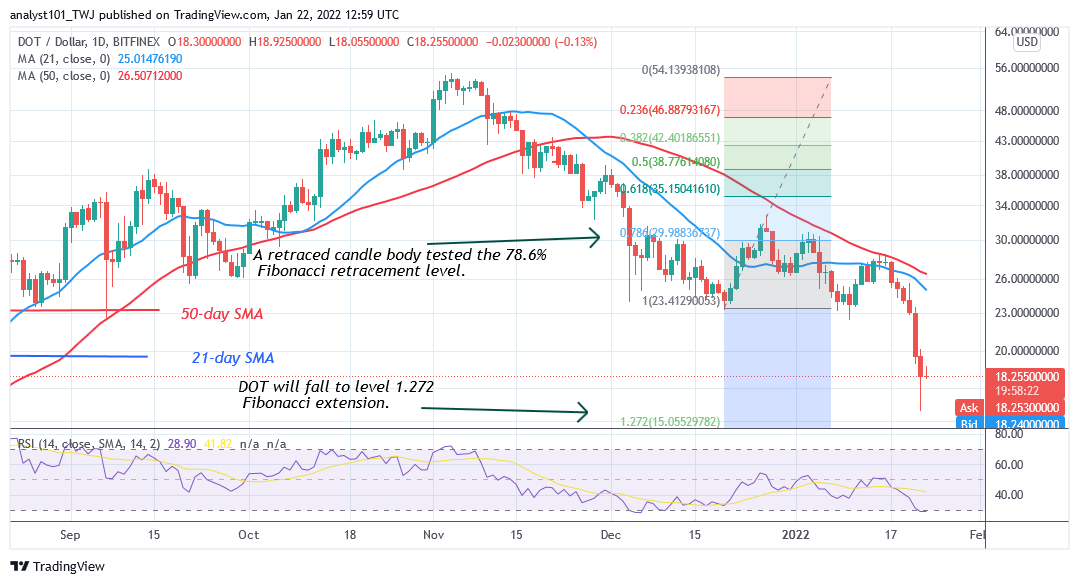
Since December 27, DOT’s price has been making a series of lower highs and lower lows. DOT/USD is falling after a rejection at a lower high of $27. Polkadot has fallen to the low of $16 and pulled back. Meanwhile, on December 20 downtrend; a retraced candle body tested the 78.6% Fibonacci retracement level. The retracement indicates that DOT price will fall to level 1.272 Fibonacci extensions or $15.05
LTC /USD Major Trend: Bearish
Litecoin’s (LTC) price has resumed a downtrend after a rejection from the $150 high. The bears broke below the previous low of $126 and slumped to another low of $108. Before the recent breakdown, Litecoin was in a range-bound move between $126 and $160 price levels.
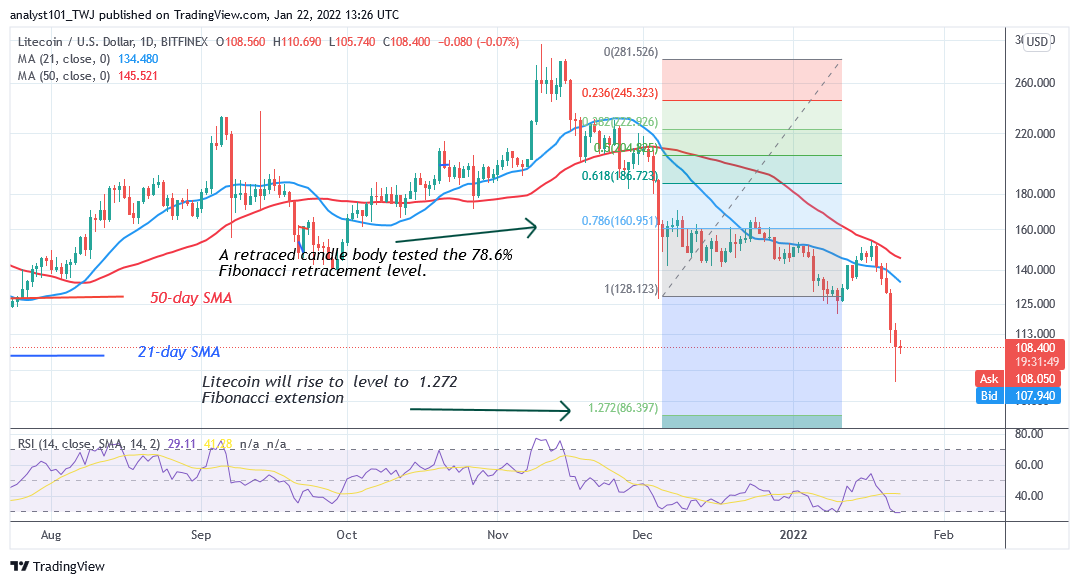
Today, further downsides are likely as price breaks the lower price range to reach the low of $96 before pulling back. Meanwhile, on December 5 downtrend; retraced candle body tested the 78.6% Fibonacci retracement level. The retracement indicates that Litecoin is likely to fall to level 1.272 Fibonacci extension or $86.39.
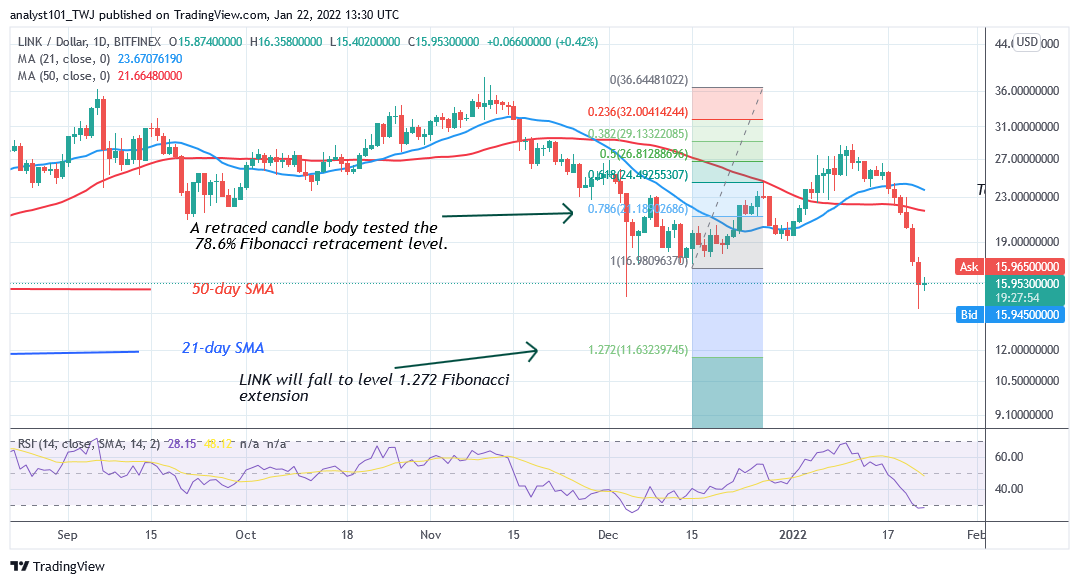
LINK /USD Major Trend: Bearish
Chainlink’s (LINK) price has resumed selling pressure as the crypto reaches deeper correction. The cryptocurrency declined to the low of $15 which is the previous low of the December 4 price slump. If the altcoin holds above the current support, the upward move will resume. On the other, if the bears break below the current support, the market will decline to $13 low. Meanwhile, on December 14 downtrend; a retraced candle body tested the 78.6% Fibonacci retracement level. The retracement indicates that LINK will fall to level 1.272 Fibonacci extension or $11.63 high.


