
Bitcoin’s (BTC) price is still in a downward correction as the largest cryptocurrency struggles below the $39,000 overhead resistance. BTC price will face deeper correction if the bears sink the crypto to the low of $30,000. Meanwhile, XRP, DOT, LTC, and LINK have all fallen to their respective oversold regions as the altcoins resume downward correction.
BTC/USD Major Trend: Bearish
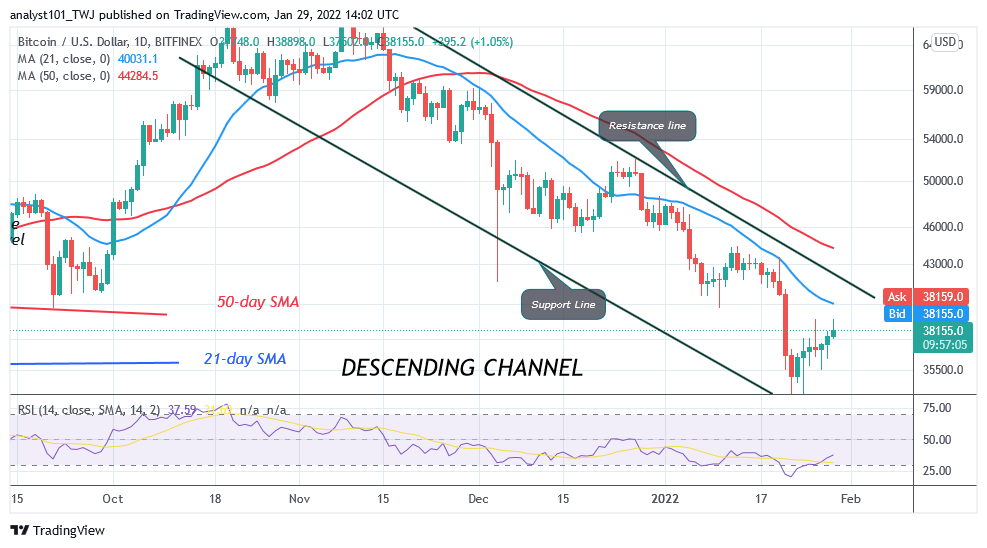
Bitcoin’s (BTC) price is trading at the bottom of the chart as it continues the downward correction. Since January 22 price slump, BTC/USD has been fluctuating between $33,600 and $39,000 price levels. For the past week, buyers have been making frantic efforts to keep the price above the $39,000 high but were repelled. On the upside, if the bulls break above the $39,000 resistance, Bitcoin will rally to $44,000 high.
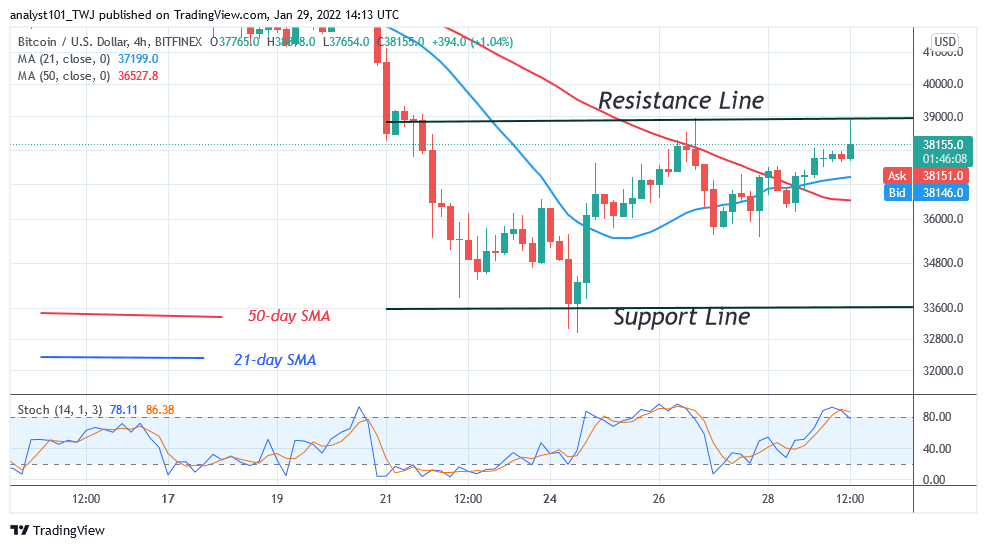
Nonetheless, if the bullish momentum extends to the $48,000 high, the BTC price will be out of downward correction. However, if the bullish scenario is invalidated, the BTC price will be compelled to a range-bound move between $33,600 and $39,000. Also, if the BTC price falls and the bears break below the $33,600 support, Bitcoin will decline to the $30,000 psychological price level.
XRP/USD Major Trend: Bearish
Ripple’s (XRP) price is still in a downward correction as the altcoin consolidates above the $0.58 support. Following the January 22 price slump, XRP fell to the low of $0.54 as bulls bought the dips. Thereafter, XRP/USD commenced a sideways move as price fluctuates between $0.58 and $65 price levels.
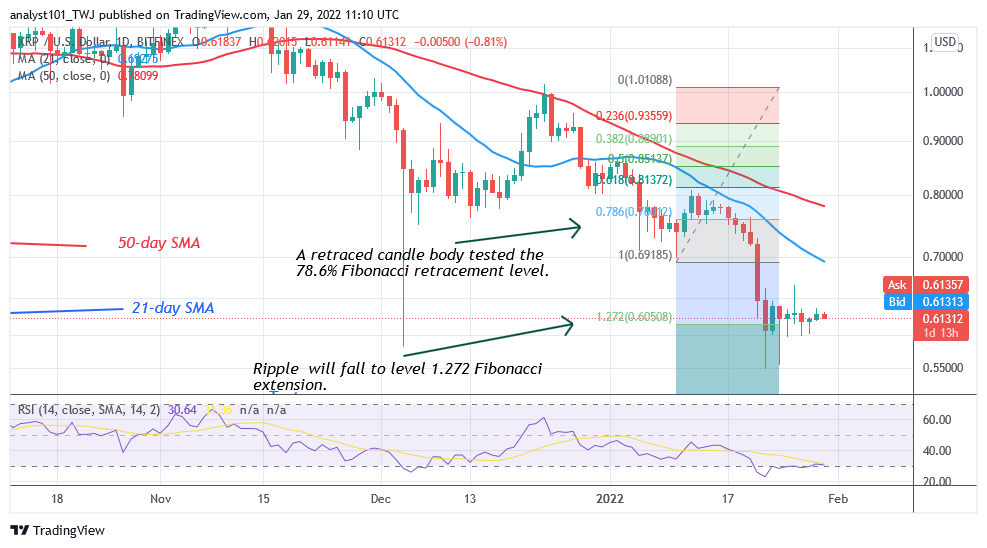
On January 26, buyers attempted to push XRP to the previous highs but were repelled. Today, XRP/USD is confined in a range but it is trading at $0.61 at the time of writing. Meanwhile, on January 10 downtrend; a retraced candle body tested the 78.6% Fibonacci retracement level. The retracement suggests that XRP will fall to level 1.272 Fibonacci extension or $0.60. From the price action, XRP is consolidating above the 1.272 Fibonacci extension.
DOT/USD Major Trend: Bearish
Polkadot’s (DOT) price is in a downward correction as the altcoin reaches bearish exhaustion. On January 22, the DOT price fell to the low of $16 and commenced a sideways move. On January 26, the upward move was resisted at the $20 high. The altcoin fell and resumed fluctuation between $16.50 and $0.20.
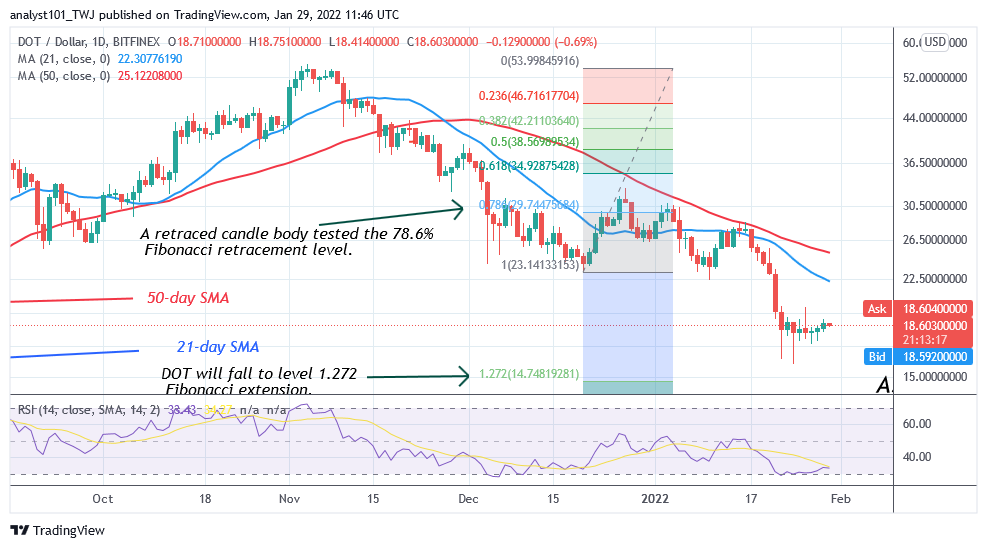
The price action is now dominated by small indecisive candlesticks called Doji and Spinning tops. These candlesticks describe indecision between buyers and sellers. The crypto is fluctuating in a tight range but it is trading at $18.59 as of press time. Meanwhile, on December 20 downtrend; a retraced candle body tested the 78.6% Fibonacci retracement level. The retracement indicates that DOT price will fall to level 1.272 Fibonacci extensions or $14.74. From the price action, the DOT price fell to $15.83 and reversed.
LTC /USD Major Trend: Bearish
Litecoin’s (LTC) price has fallen and reached the oversold region but . The market has reached the low of $96.33 as bulls bought the dips. On January 26, the LTC price corrected upward but was repelled at $117. LTC price is in a range-bound move as the altcoin fluctuates between $106 and $117 price levels.
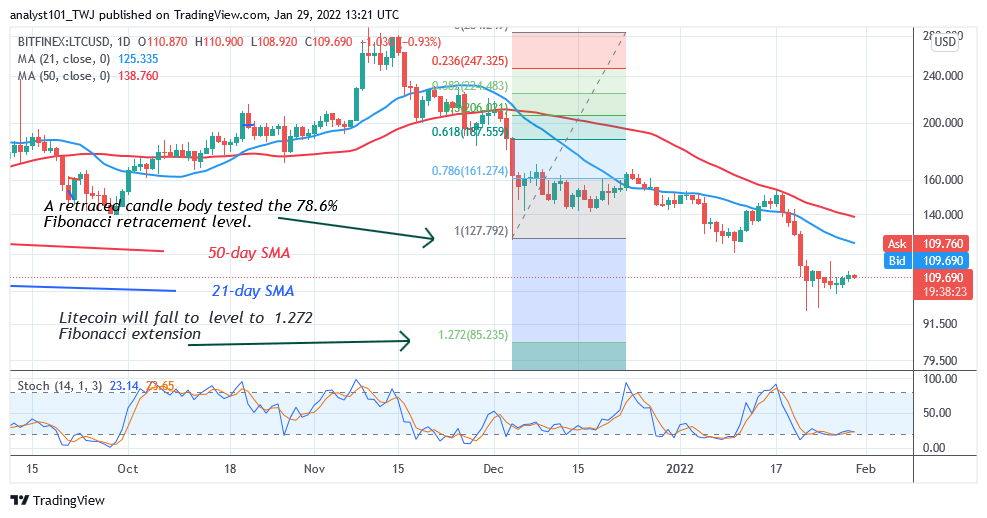
On the upside, if buyers breach the initial resistance at $117, the LTC price will rally to $150 high. On the downside, two candlesticks with long tails are pointing to the downside. The long candlestick tails are describing that there is strong buying pressure at lower price levels. Meanwhile, on December 4 downtrend; retraced candle body tested the 78.6% Fibonacci retracement level. The retracement indicates that Litecoin is likely to fall but reverse at level 1.272 Fibonacci extension or $85.23. From the price action, the LTC price has reversed after reaching the low of $96.
LINK /USD Major Trend: Bearish
Chainlink’s (LINK) price has fallen and reached an oversold region of the market. On January 24, the altcoin fell to the low of $13.50 as bulls bought the dips. On January 26, the upward move is facing resistance at level $16.
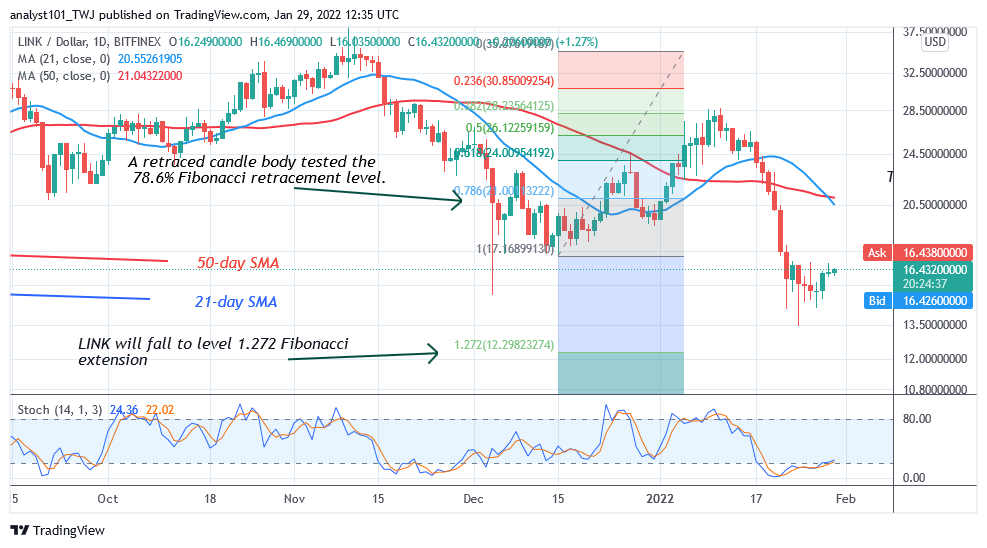
Since January 22, the cryptocurrency has been trading in a tight range between $15 and $17 price levels. Chainlink will tend to rise if price breaks above the $17 resistance. On the other hand, if the bears break below the current support, the market will decline to $13 low. Meanwhile, on December 14 downtrend; a retraced candle body tested the 78.6% Fibonacci retracement level. The retracement indicates that LINK will fall to level 1.272 Fibonacci extension or $12.29 high.


