
Bitcoin has fallen and retested the $40,000 psychological price level as bulls bought the dips. The cryptocurrency has also fallen to the oversold region of the market. Further selling pressure is unlikely. Ripple and the other altcoins are trading in the oversold region of the market. However, Chainlink has regained bullish momentum.
BTC/USD Major Trend: Bearish
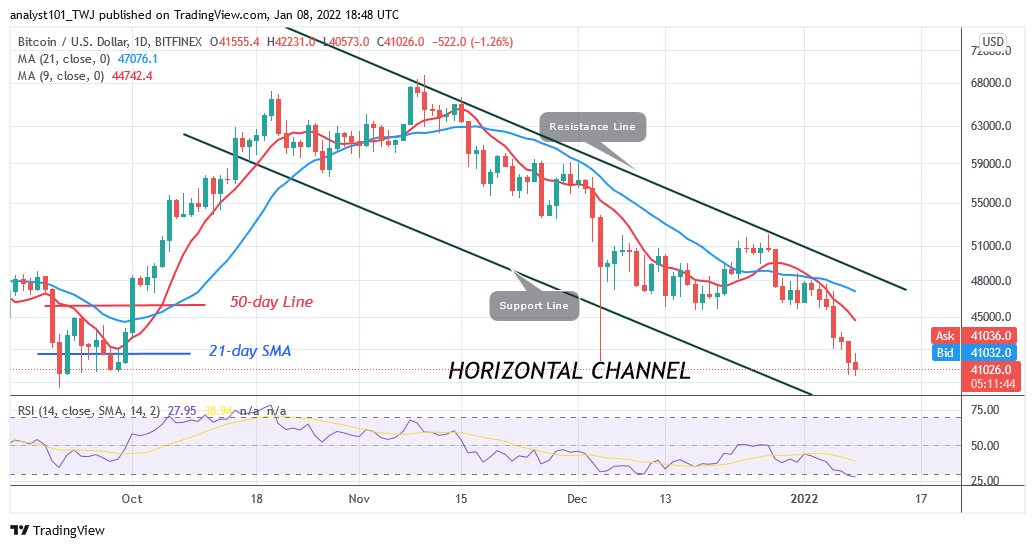
Bitcoin’s (BTC) price loses $45,600 support as the cryptocurrency resumed deeper downward correction. For the past week, Bitcoin was range-bound between $45,600 and $4 8,000 price levels. The bears have the upper hand as they broke below the $45,600 support. Today, BTC/USD has declined to $40,801 but has resumed upward to the high of $41,967 at press time. Bitcoin has fallen to the oversold region of the market. The selling pressure is likely to end. The king coin is at level 27 of the Relative Strength Index for period 14.
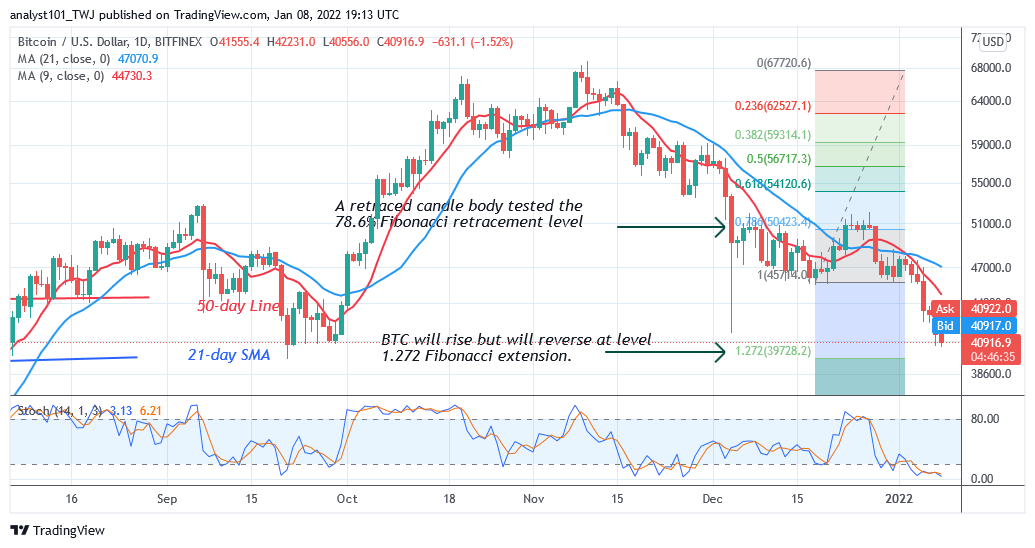
Bitcoin is below the 20% range of the daily stochastic. The price indicators have shown that Bitcoin has reached bearish exhaustion. Buyers are likely to emerge. Meanwhile, on December 18 downtrend; a retraced candle body tested the 78.6% Fibonacci retracement level. The retracement suggests that BTC will rise but will reverse at level 1.272 Fibonacci extension or $39,728.20. From the price action, Bitcoin has resumed upward.
XRP/USD Major Trend: Bearish
Ripple’s (XRP) price is in a downward correction as the altcoin revisits the $0.72 low. On December 23, the XRP price broke above the moving averages as the altcoin reached the high of $1.00. Buyers could not keep the price above the $1.00 overhead resistance. XRP price reached an overbought region but was repelled.
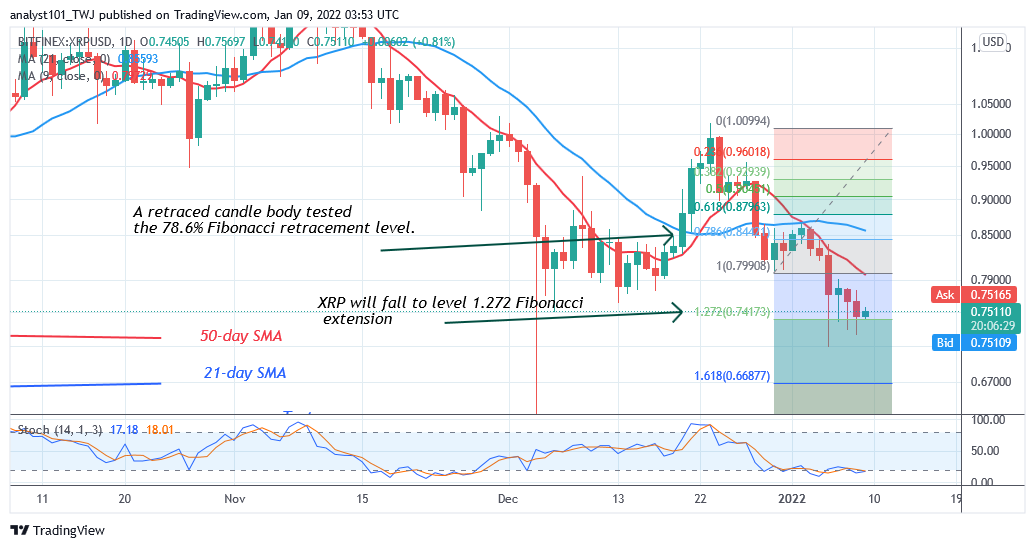
Consequently, XRP/USD dropped sharply to the low of $0.80. The cryptocurrency faced another rejection after price corrected upward to the high of $0.85. Today, Ripple has fallen to the oversold region of the market. The selling pressure has subsided as buyers resumed upward. Meanwhile, on December 30 downtrend; a retraced candle body tested the 78.6% Fibonacci retracement level. The retracement suggests that XRP price will fall but reverse at level 1.272 Fibonacci extension or $0.74. From the price action, XRP is trading at $0.75 at press time.
DOT/USD Major Trend: Bearish
Polkadot’s (DOT) price has resumed downward correction after facing two rejections from the previous highs. On the daily chart, the bulls retested two previous highs. On December 27, the bulls break above the moving averages but could not sustain the bullish momentum above the $32 high.
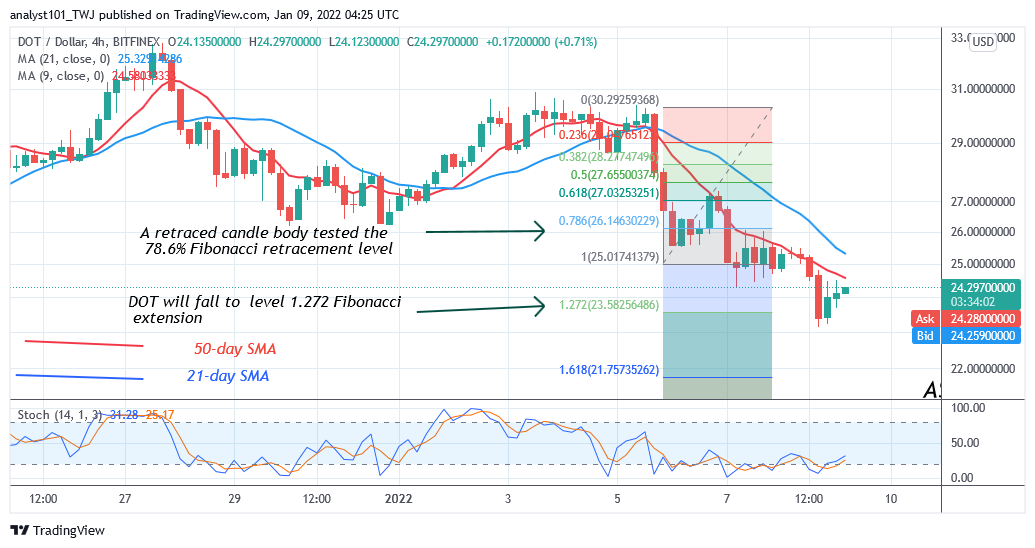
DOT price fell below the moving averages. The bulls made another attempt on January 4 but the altcoin was repelled at the $30 resistance. The market has declined to the previous low at $23. On the 4- chart, the altcoin has fallen to the oversold region. Meanwhile, on January 5 downtrend; a retraced candle body tested the 78.6% Fibonacci retracement level. The retracement indicates that DOT price will fall but reverse at level 1.272 Fibonacci extensions or $23.58.
LTC /USD Major Trend: Bearish
Litecoin’s (LTC) price has resumed downward correction despite its positive moves above the moving averages. On December 23, the bulls break above the moving averages to reach the high of $165. Buyers could not sustain the bullish momentum as the market reaches the overbought region.
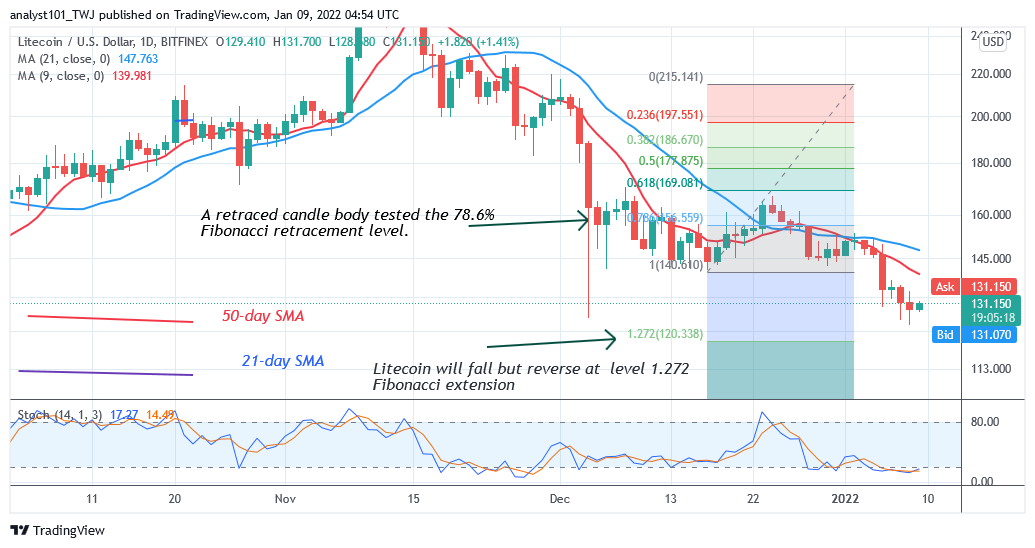
Litecoin faced rejection as the market declined to $124 low as bulls bought the dips. The cryptocurrency is hovering above the previous low of the December 4 price slump of $126. Litecoin is below the 20% range of the daily stochastic. Further selling pressure is doubtful as the market reaches the oversold region. Meanwhile, on December 17 downtrend; retraced candle body tested the 78.6% Fibonacci retracement level. The retracement indicates that Litecoin is likely to fall but reverse at level 1.272 Fibonacci extension or $120.33.
LINK /USD Major Trend: Bullish
Chainlink’s (LINK) price has resumed bullish momentum as price breaks above the moving averages. Chainlink is approaching the high of $28. The altcoin is likely to face resistance at the recent high. The cryptocurrency is above the 80% range of the daily stochastic.
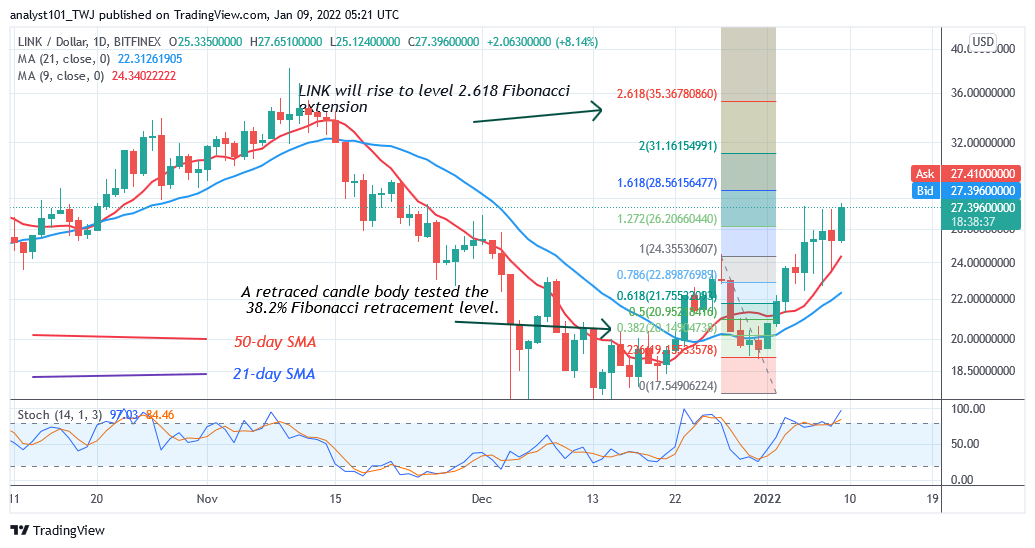
It indicates that the market is approaching the overbought region of the market. The upward move may face resistance at the recent high. On the other hand, if buyers overcome the $28 high, Chainlink will rally to $35. Meanwhile, on December 27 uptrend; a retraced candle body tested the 38.2% Fibonacci retracement level. The retracement indicates that LINK will rise to level 2.618 Fibonacci extension or $35.36 high. From the price action, the market has reached the high of $27.22.


