
Bitcoin’s (BTC) price is now trading in a tight range between $31,000 and $34,400. Bitcoin price is characterized by small body indecisive candlesticks called Doji and Spinning tops. These candlesticks indicate that buyers and sellers are undecided about the direction of the market. The king coin is likely to be range-bound. Meanwhile, Ripple, Polkadot, Litecoin, and Chainlink are yet to break into the previous highs. The altcoins are still in a downward correction.
BTC/USD Major Trend: Bearish
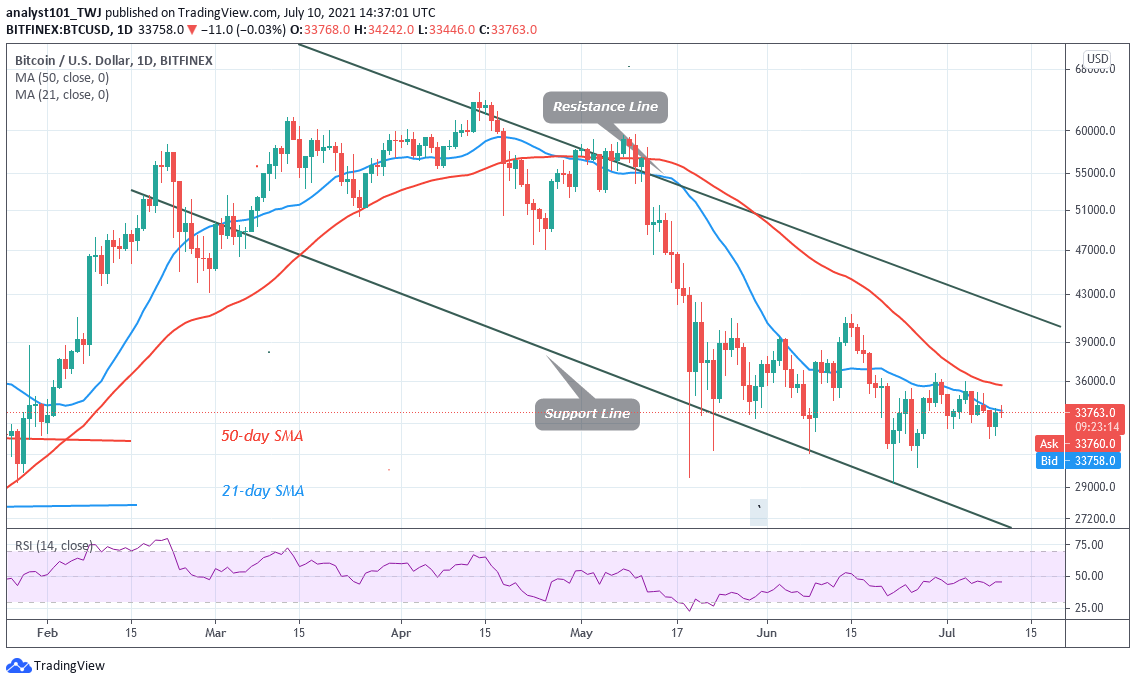
Bitcoin’s (BTC) price is confined in a narrow range between $31,000 and $34,400. Before Bitcoin is stuck below $34,400 price level, buyers have retested the $35,000 resistance level on four occasions without breaking the resistance. On July 7 rejection, the bears have the advantage of pushing BTC price to the critical support above $31,000. However, the bulls bought the dips as the crypto slumped to $32,100. Buyers have taken control and pushed BTC’s price to the previous high below $34,400.
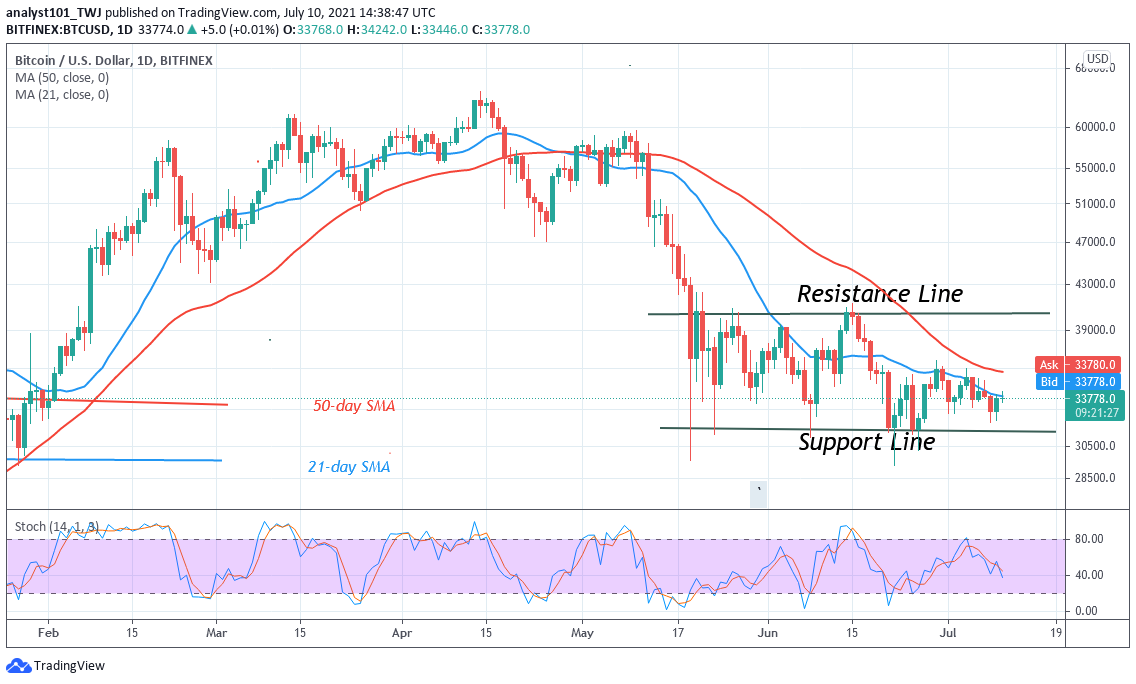
BTC price upward move is doubtful because of overwhelming selling pressure at higher price levels. The king coin would have further declined if sellers have succeeded in sinking the crypto below the $31,000 support. As bulls bought the dips, BTC/USD will resume its range-bound move between $31,000 and $41,273 price levels. However, the upward move is doubtful as Bitcoin is stuck below the $34,400 high.
XRP/USD Major Trend: Bearish
In the last bearish impulse on July 9, Ripple (XRP) revisited the previous low at $0.59 as bulls bought the dips. There was a long candlestick pointing toward the previous low at $0.59. The candlestick indicates that there is strong buying pressure above the previous support. XRP has rebounded above the $0.60 support signaling the resumption of bullish momentum.
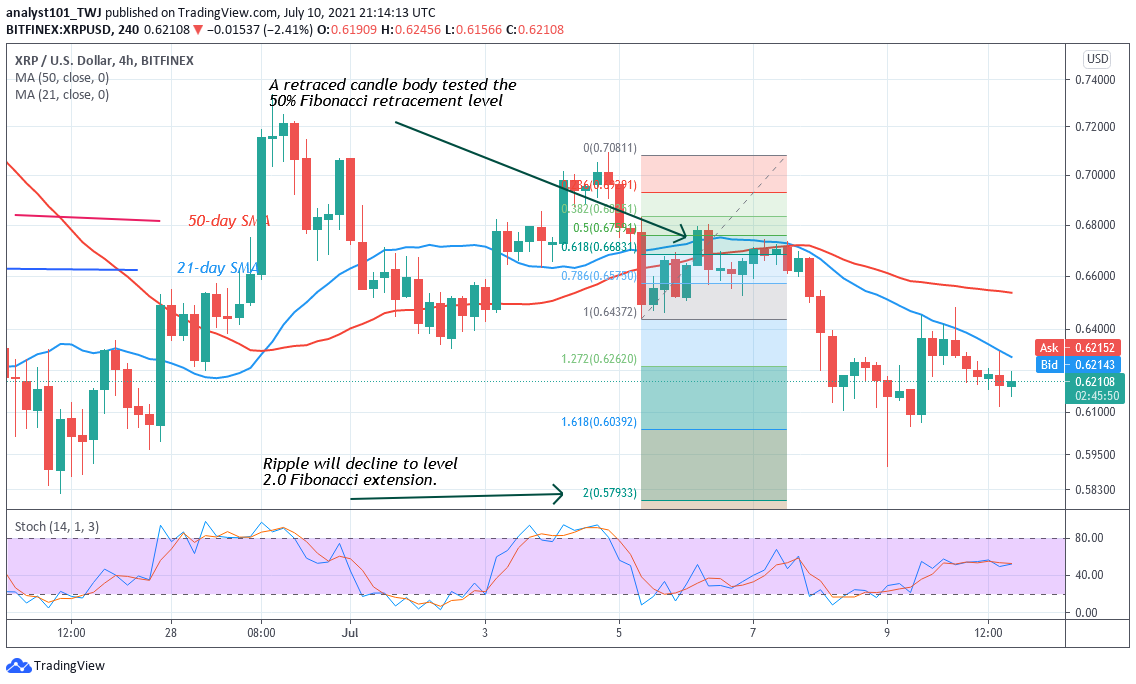
The selling pressure appears to have subsided as the price consolidates above the current support. Bullish candlesticks are indicating a possible upward move of the crypto. Ripple will revisit the previous highs of $0.68 and $0.70 if the bullish momentum resumes. It is unlikely if the bearish trend will continue as indicated at the 2.0 Fibonacci extension. Meanwhile, on July 5 downtrend; a retraced candle body tested the 50% Fibonacci retracement level. The retracement indicates that XRP price will fall to level 2.0 Fibonacci extension or level $0.579. From the price action, XRP has retested the 2.0 Fibonacci extension with a long candlestick tail. This week, Ripple will regain bullish momentum as price will reach the high of $0.66.
DOT/USD Major Trend: Bearish
Polkadot’s price is confined between $13.50 and $17. DOT price has fallen to $13.50 because of yesterday’s rejection. It has risen to $15.35 at the time of writing. Buyers have made three attempts to break the $17 high. In the third attempt, the bulls break the resistance to reach the high of $17.65. The selling pressure above the recent high was overwhelming as bears push DOT to the range-bound zone. On the upside, if buyers push the DOT price above $17 and the bullish momentum is sustained the market will rise to $21.50 high. The bullish momentum is likely to extend to the $25.50 high.
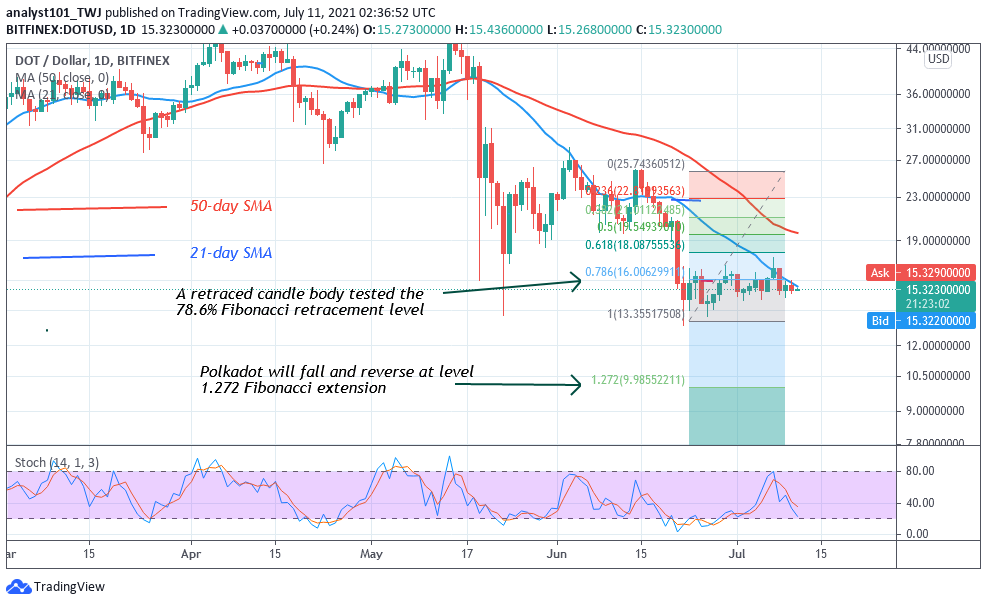
However, if buyers are repelled at the recent high, DOT price is likely to fall to breach the $13 support. The market has reached bearish exhaustion as the altcoin may reverse. On July 9 downtrend; a retraced candle body tested the 78.6% Fibonacci retracement level. The retracement indicates that DOT price will fall to level 1.272 Fibonacci extensions or level $14.07 and reverse. The crypto will reverse to 78.6% Fibonacci retracement level where it originated.
LTC /USD Major Trend: Bearish
On July 9, Litecoin plunged to $125.82 as bulls bought the dips. The crypto rebounded above $129 support as price rallied to $137 high. Buyers fail to sustain the bullish momentum above $137 high as the crypto was compelled to a sideways move. The selling pressure will resume if the bulls fail to break the $137 resistance. Nonetheless, LTC will rally to a $143 high if the current resistance is breached.
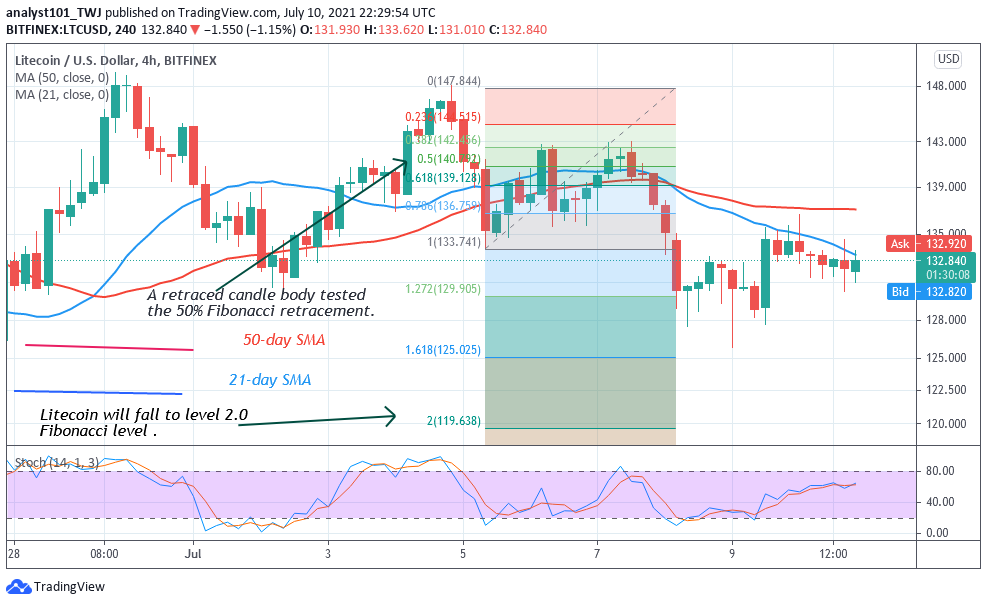
However, the Fibonacci tool has indicated a further downward movement of crypto. Meanwhile, on July 5 downtrend; a retraced candle body tested the 50% Fibonacci retracement level. The retracement indicates that Litecoin is likely to fall to level 2.0 Fibonacci extension or level $119.63. In the meantime, the market is in a bullish momentum but price is approaching the overbought region of the market The implication is that Litecoin will fall at the overbought region.
LINK /USD Major Trend: Bearish
Following the last bearish impulse of June 22, Chainlink slumped to $15.05 as bulls bought the dips. The price corrected upward to resume consolidation. LINK/USD now fluctuates between $17.60 and $19 price levels. Today, the bulls are retesting the resistance level to sustain XRP above it. Chainlink is falling to revisit the previous low at $17.60.
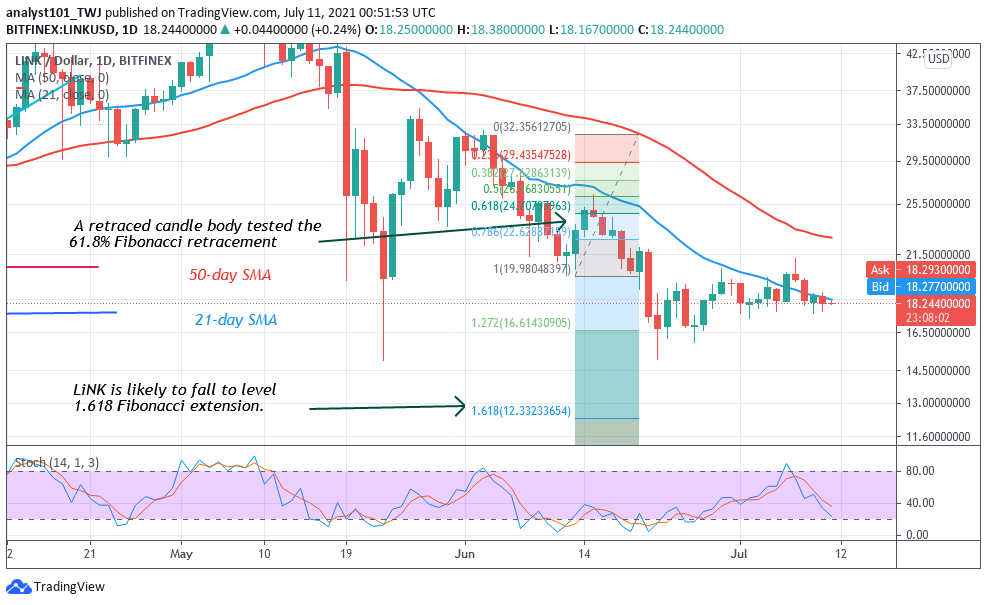
The altcoin will resume trending if the range-bound levels are breached. For instance, if buyers breach the $19 high, the crypto’s price will rally to $21.50 resistance and possibly break it. Nonetheless, if the bears break the $15.50 support, the market will decline to $12. Meanwhile, on June 13 downtrend; a retraced candle body tested the 61.8% Fibonacci retracement level. The retracement indicates that LINK is likely to fall to level 1.618 Fibonacci extension or level $12.33.


