
Bitcoin and the altcoins have made a further downward move. The cryptocurrencies were unable to sustain their previous bullish move, hence the selling pressure. The bears sold at the recent rally as the altcoins declined below the moving average lines.
BTC/USD Major Trend: Bearish
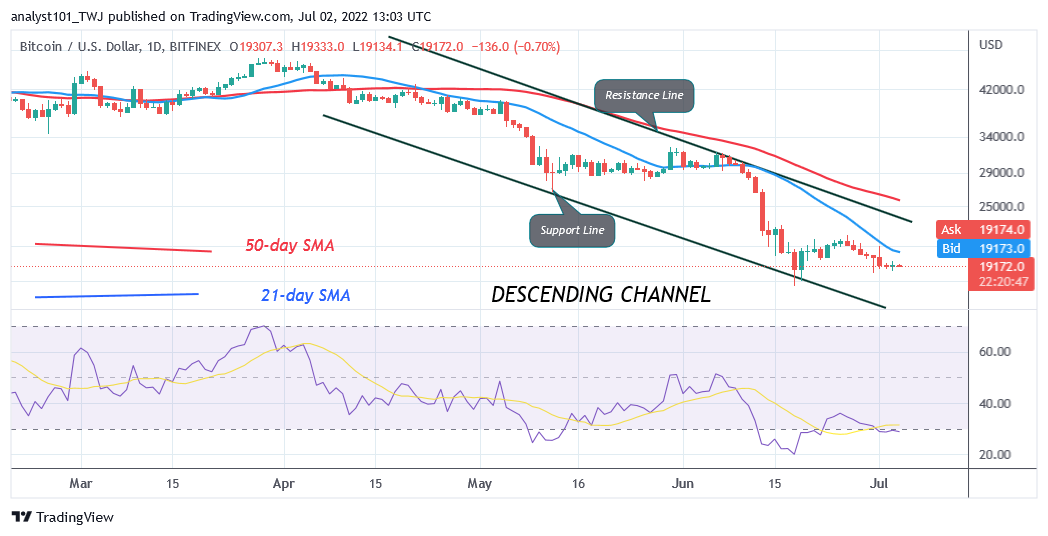
Bitcoin’s (BTC) price is in a downtrend as the cryptocurrency resumed selling pressure. Since June 26, Bitcoin has been on a steady decline from the high of $22,000. The cryptocurrency declined to the low of $18,638 and pulled back. Today, BTC’s price is trading at $19,149 at the time of writing. Since July 1, the price action has been characterized by small body indecisive candlesticks called Doji.
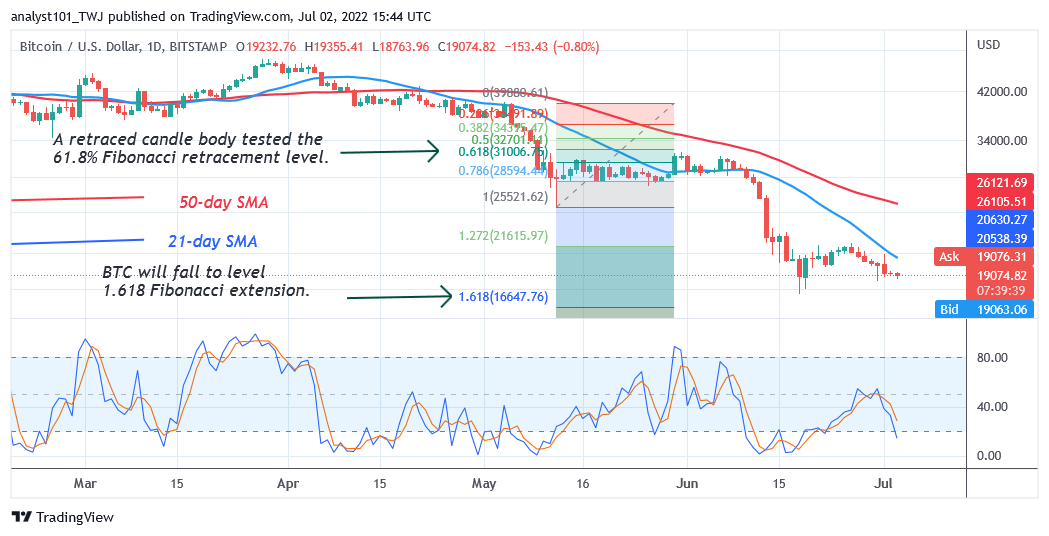
The Doji candlesticks indicate that buyers and sellers have reached a period of indecision. Meanwhile, on May 12 downtrend; a retraced candle body tested the 61.8% Fibonacci retracement level. The retracement indicates that the BTC price will fall to level 1.618 Fibonacci extension or $16,647.17. From the price action, Bitcoin has declined and it is hovering above the $19,000 support.
SAND/USD Major Trend: Bearish
The Sandbox (SAND) price is in a downward correction as price fluctuates between the moving average lines. For the past week, the cryptocurrency has been fluctuating between the moving average lines to breach the lines. On June 25 uptrend, the bulls failed to breach the 50-day line SMA.
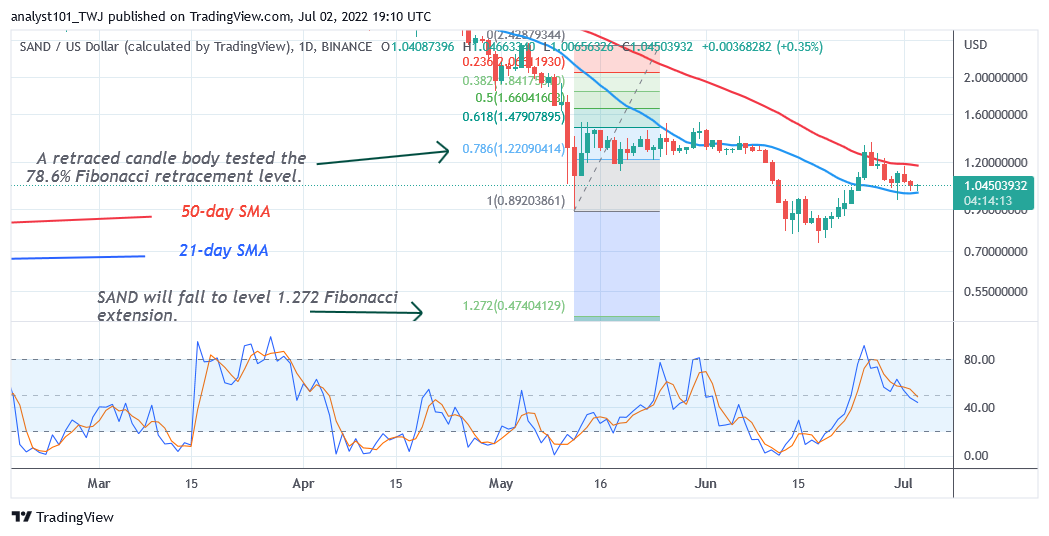
The breaking of the 50-day line SMA and the sustenance of the bullish momentum will signal the resumption of the uptrend. Today, SAND has retraced and found support above the 21-day line SMA. On the upside, the altcoin may rebound and revisit the previous highs. However, if the bears break below the 21-day line SMA, SAND/USD will fall and revisit the previous low at $0..90. Meanwhile, on May 12 downtrend; a retraced candle body tested the 78.6% Fibonacci retracement level. The retracement indicates that SAND will fall to level 1.272 Fibonacci extension or $0.47 price level.
MANA/USD Major Trend: Bearish
Decentraland (MANA) price is in a downtrend as price breaks below the moving averages. This is an indication of a further downward movement of the coin. On June 25, the upward movement of the coin has been interrupted. The bulls failed to sustain the bullish momentum above the moving average lines.
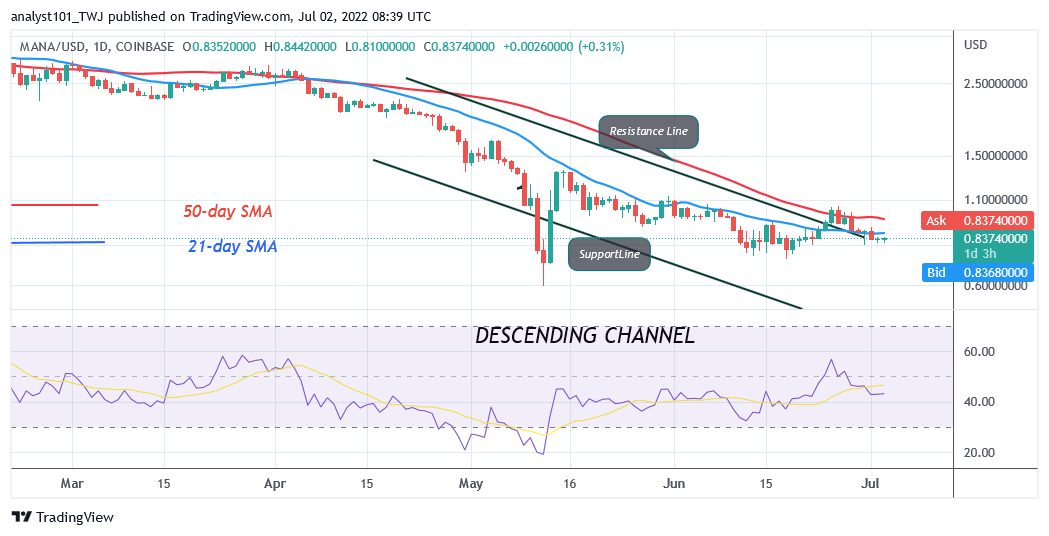
The bears have broken below the moving averages to resume selling pressure. On the downside, the altcoin will decline and revisit the previous low of $0.72 and $0.59 price levels. MANA is at level 42 of the Relative Strength Index for period 14. It indicates that the altcoin is in the ‘downtrend zone and capable of a further downward move.
APE /USD Major Trend: Bearish
ApeCoin’s (Ape) price is in a downtrend but it is making an upward correction. The bulls have broken above the 21-day line SMA but below the 50-day line SMA. Since June 25, the cryptocurrency has been confined between the moving average lines. The altcoin will trend when the range-bound levels are breached.
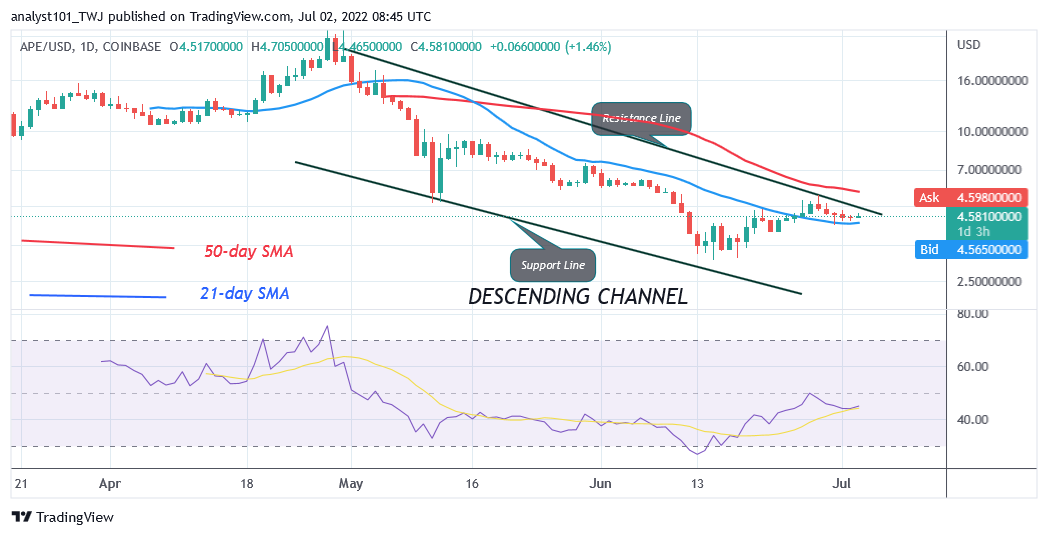
On the upside, if the bulls breach the 50-day line SMA, the market will rally to $17. Conversely, if the bears break below the 21-day line SMA, APE will resume selling pressure as the altcoin revisit the previous low of $3. The coin is at level 45 of the Relative Strength Index for period 14. It indicates that it is in the downtrend zone and capable of further decline.
ENJ /USD Major Trend: Bearish
Enjin Coin (ENJ) is in a downtrend as price breaks below the moving average lines. Buyers could not keep the price above the 50-day line SMA. After four days of struggle to break the 50-day line SMA, the altcoin suffered another decline. ENJ will decline and revisit the previous low of $0.37.
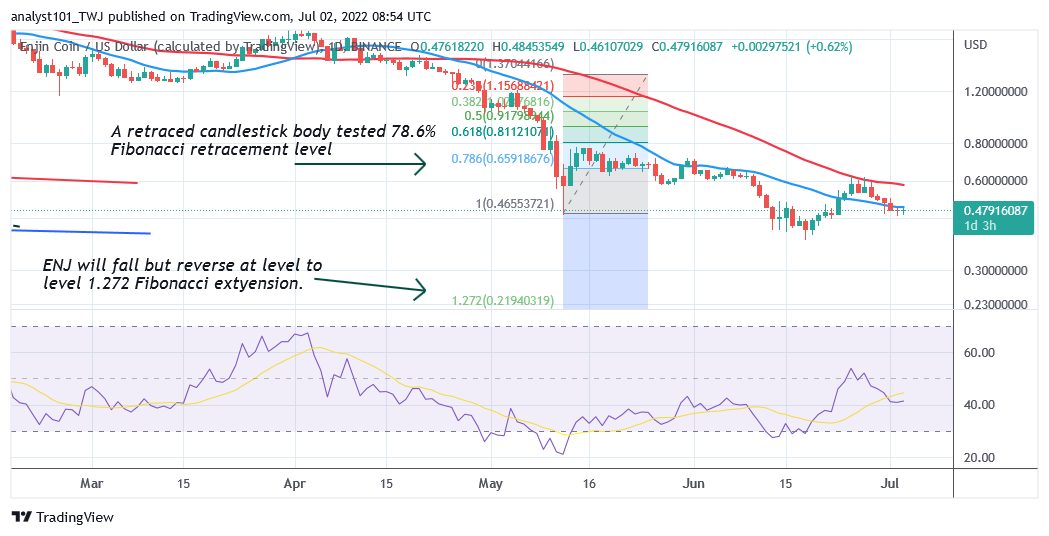
Meanwhile, on May 12 downtrend; a retraced candle body tested the 78.6% Fibonacci retracement level. The retracement indicates that ENJ will fall to level 1.272 Fibonacci extension or $0.21. The coin is at level 41 of the Relative Strength Index for period 14. It indicates that the cryptocurrency is in the downtrend zone and capable of a further decline.


