
Bitcoin and the altcoins have fallen below their critical support level. For instance, Bitcoin has fallen from the $20,000 psychological price level. The $20,000 price level is regarded as the bottom price level. However, the current breakdown may result in panic selling and buying among traders and investors. Let us examine each of these coins.
BTC/USD Major Trend: Bearish
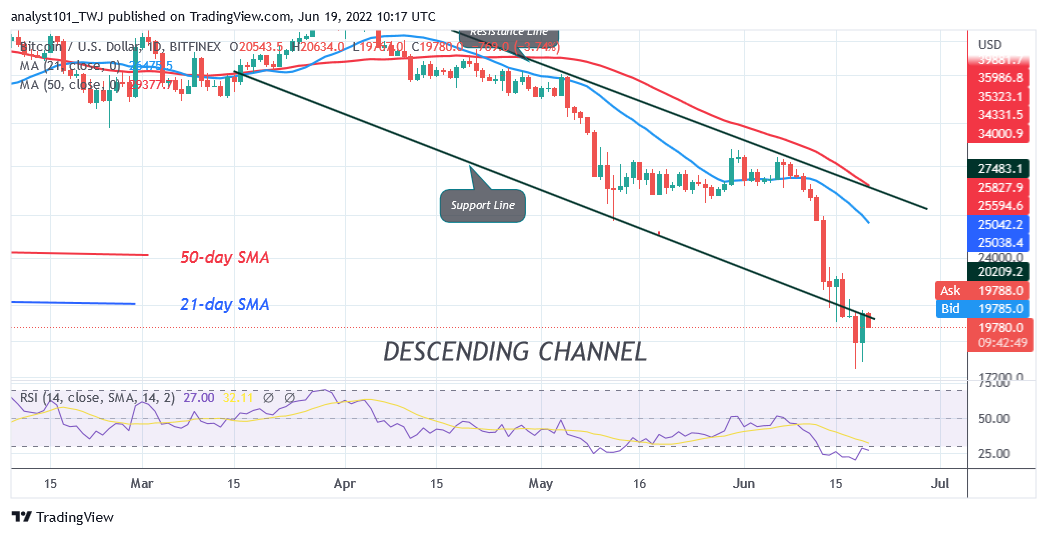
On June 14, Bitcoin’s (BTC) price declined to $20,859 low and resumed consolidation above it. BTC’s price traded above the $20,000 support for four days before it was breached. On June 18, the bears broke below the $20,000 support as the largest cryptocurrency dropped to a low of $17,605 but the bulls bought the dips. BTC price corrected upward to the high of $20,744 on June 19. However, the $20,000 support has been turned to resistance by the bears. Buyers could not sustain the bullish momentum above the $20,000 support.
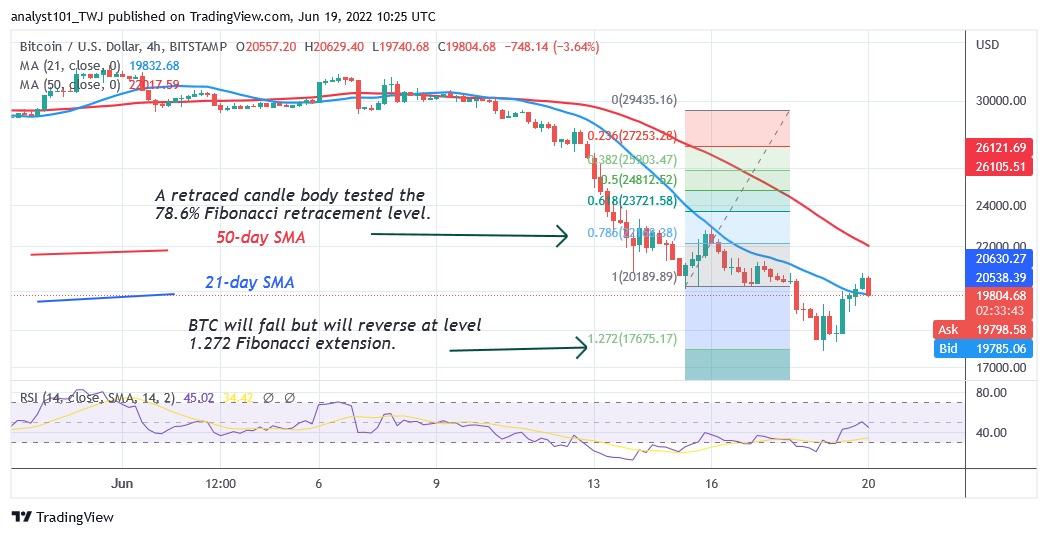
Presently, BTC’s price has fallen below the $20,000 support. Further upward move is likely to face resistance at the 21-day line SMA. In addition, there will be panic buying and selling as Bitcoin falls below the $20,000 price level. The current momentum may extend to the low of $17,500 price level. Meanwhile, on June 15 downtrend; a retraced candle body tested the 78.6% Fibonacci retracement level. The retracement indicates that BTC will fall but will reverse at level 1.272 Fibonacci extension or $17,675.17. From the price action, Bitcoin has retested the current low and corrected upward.
SAND/USD Major Trend: Bearish
The Sandbox (SAND) price has further declined to the low of $0.78. On June 12, the bears broke below the previous low of $0.90 as the altcoin fell above the $0.78 support.
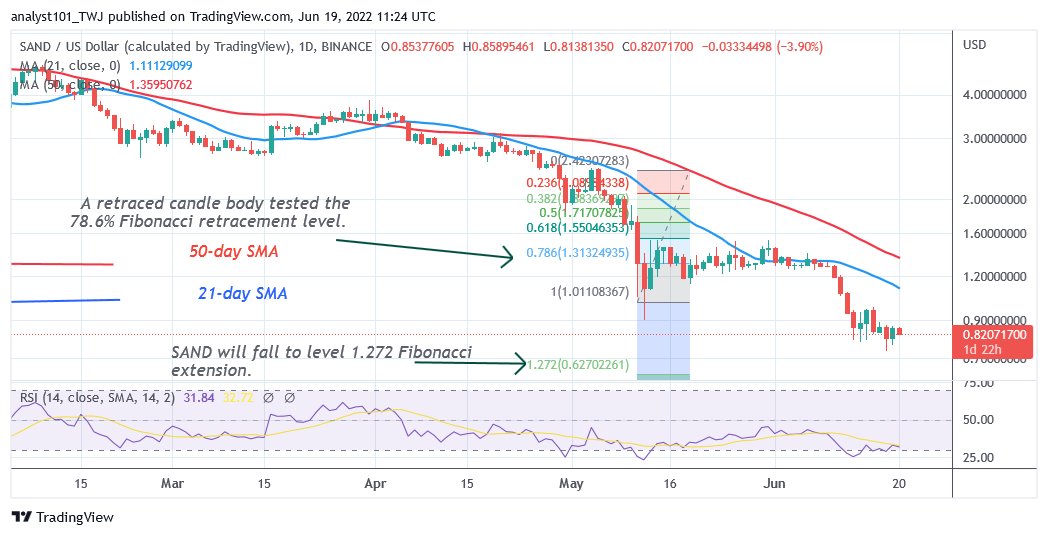
Since June 13, the SAND has been consolidating above the $0.78 support. The cryptocurrency has fallen to the oversold region of the market. Further selling pressure is unlikely as the market reaches the oversold region. Meanwhile, on May 11 downtrend; a retraced candle body tested the 78.6% Fibonacci retracement level. The retracement indicates that the altcoin will fall but reverse at level 1.272 Fibonacci extension or $0.62 price level.
MANA/USD Major Trend: Bearish
Decentraland (MANA) price has fallen significantly to the bottom of the chart. In the previous price action, the altcoin plunged to the low of $0.59 and pulled back on May 12. The crypto’s price corrected upward to the high of $1.36 but was restricted by the 21-day line SMA.

Since May 12, the coin has been falling to the previous low. Today, the coin has declined to $0.80 price level. Meanwhile, on a weekly chart, a retraced candle body tested the 78.6% Fibonacci retracement level on January 31. The retracement suggests that MANA will fall but reversed at level 1.272 Fibonacci extensions or $0.566. From the price action, MANA has fallen to the low of $0.79.
APE /USD Major Trend: Bearish
ApeCoin’s (Ape) price is in a downtrend as it fell to the low of $3.20 on June 13. Following the recent price slump, the altcoin has resumed a range-bound move above the current support.
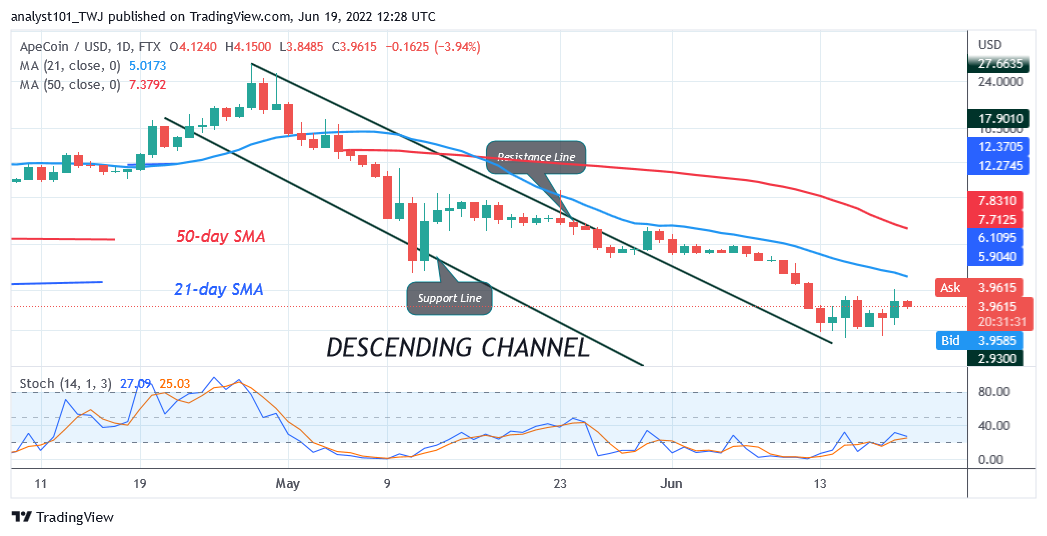
For the past week, APE/USD has been fluctuating between $3.20 and $4.50 price levels. The selling pressure will resume if the price breaks below the $3.20 support. On the other hand, if price breaks the resistance at $4.50, the coin will rally above the 21-day line SMA. Meanwhile, the altcoin is below the 20% range of the daily stochastic. The cryptocurrency is in the oversold region of the market. Buyers will emerge in the oversold region to push prices upward.
ENJ /USD Major Trend: Bearish
Enjin Coin (ENJ) is in a downtrend and the cryptocurrency has fallen significantly. The bears have broken below the historical price level of June 21, 2021, of $0.76. Today, the altcoin is trading at $0.43 at the time of writing.
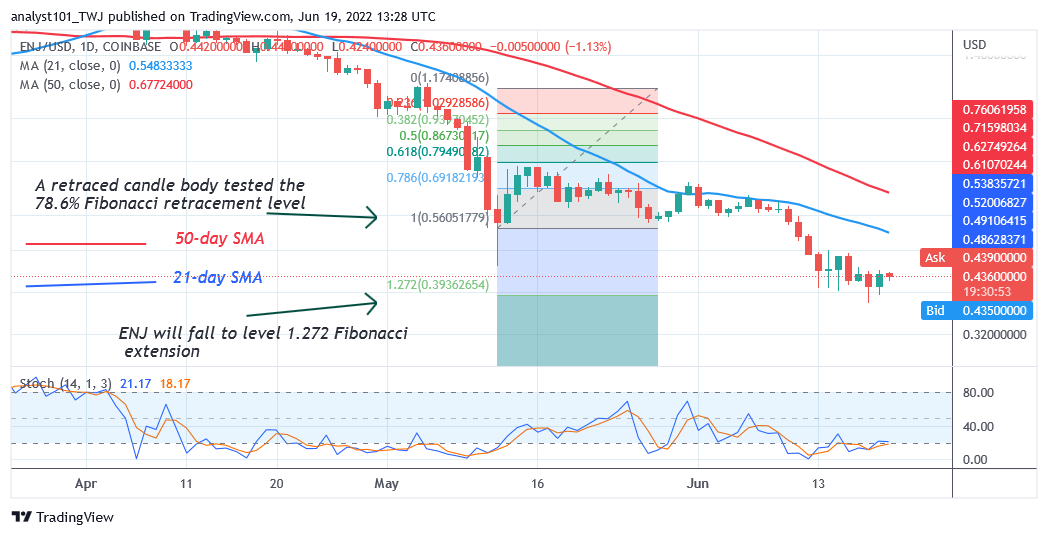
Enjin Coin is below the 20% range of the daily stochastic. The coin has reached the oversold region of the market. Meanwhile, on May 12 downtrend, a retraced candle body tested the 78.6% Fibonacci retracement level. The retracement indicates that ENJ will fall to level 1.272 Fibonacci extension or $0.39. From the price action, the coin has fallen to the 1.272 Fibonacci extension and it is consolidating above the current support.


