
Bitcoin and other altcoins above have made positive moves for the past five days. However, the cryptos brief uptrend have been stalled as the markets reached the overbought region. A downtrend is expected if the cryptos face rejection at the recent high. The current trend will resume if the resistance levels are cleared.
BTC/USD Major Trend: Bearish
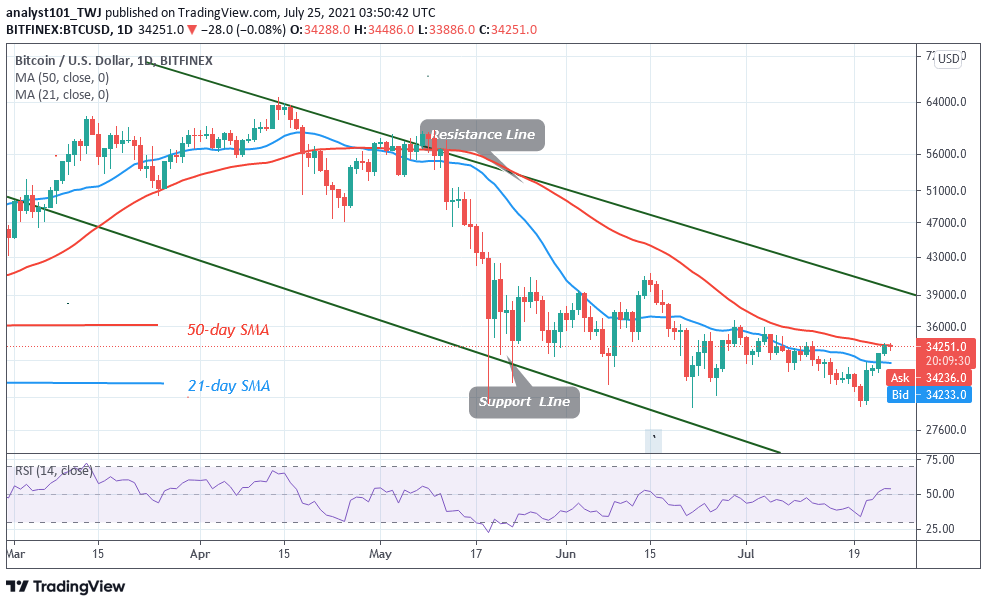
Bitcoin’s (BTC) price rebounded and rallied to the high of $34,244. On July 20, BTC’s price consolidated above the $29,400 support as bulls bought the dips. This propels Bitcoin to have a strong rebound as it reached the high of $34,244. Bitcoin’s upward move is doubtful as the market reaches the overbought region. On the upside, if buyers clear the resistance zones of $34,400 to $35,000, Bitcoin will rally to $37,000 high. Conversely, if Bitcoin faces rejection at the resistance zones, the market is expected to decline. The bears will take advantage to sink the crypto to the previous low at $29,400.
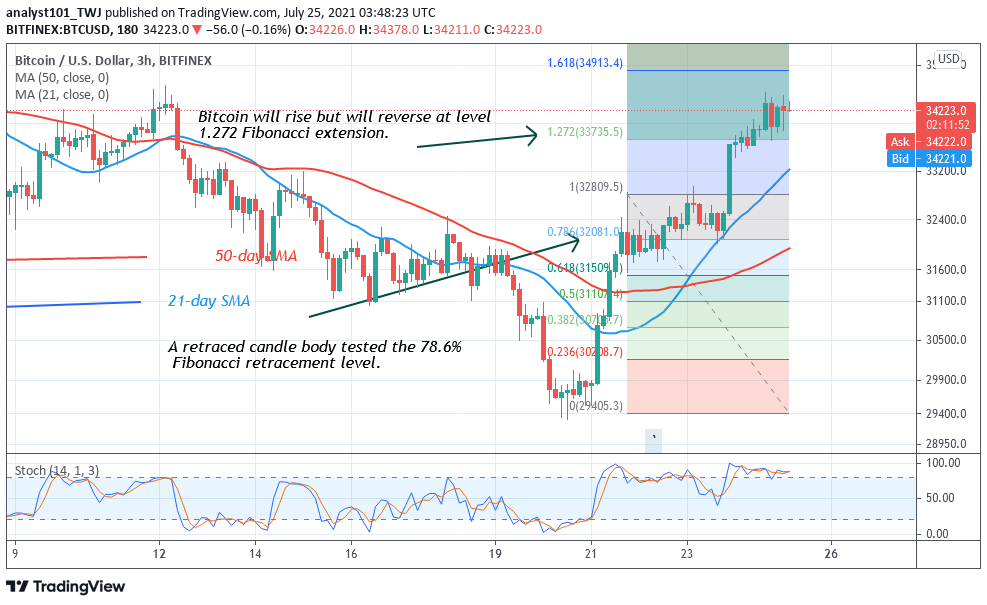
Later, Bitcoin will further decline to $28,000 if the previous low is breached. Meanwhile, on July 21 uptrend; a retraced candle body tested the 78.6% Fibonacci retracement level. The retracement indicates that Bitcoin will rise but reverse at level 1.272 Fibonacci extension or level $33,756.60. On the downside, if Bitcoin retraces, it will return to the 78.6% Fibonacci retracement level where it originated.
XRP/USD Major Trend: Bearish
Today, Ripple’s (XRP) price makes an impressive run as the market reaches the high of $0.62. On July 20, the crypto has earlier rebounded above the previous low at $0.51 as bulls bought the dips. XRP’s recent rally has reached the overbought region of the market. Sellers are likely to emerge to push prices downward. If XRP faces rejection at the $0.62 high, Ripple will resume a downtrend.
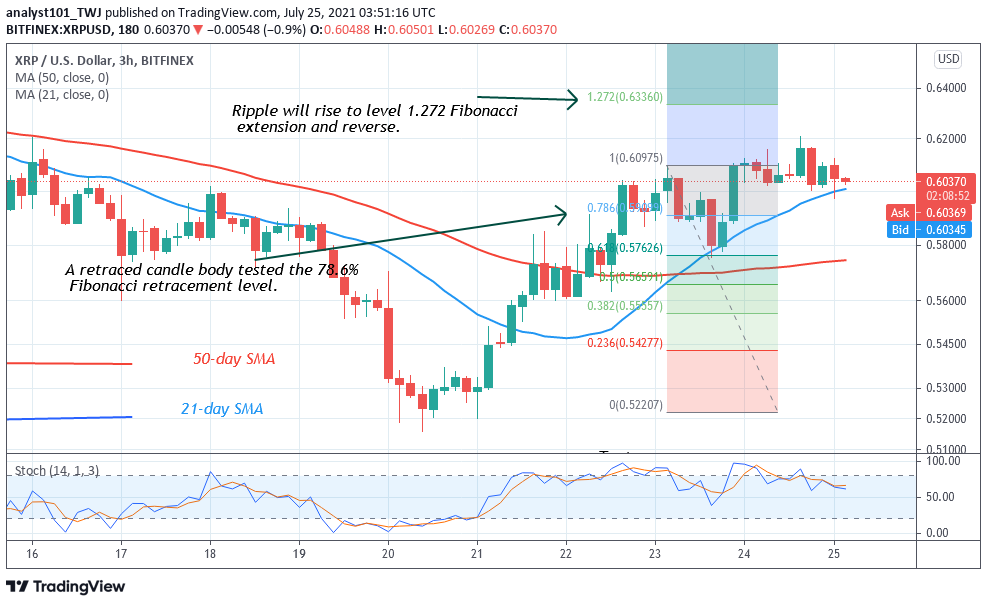
The bears will attempt to pull the price below the $0.51 support. When the previous low is breached, XRP will further decline to either $0.45 or $0.30.Today, XRP has retraced to the support above $0.60. Meanwhile, on July 21 uptrend; a retraced candle body tested the 78.6% Fibonacci retracement level. The retracement indicates that Ripple is likely to rise but will reverse at level 1.272 Fibonacci extension or level $0.60. The altcoin will reverse and return to the 78.6% Fibonacci retracement level where it originated. From the price action, XRP is falling to retest the 78.6% Fibonacci retracement level.
DOT/USD Major Trend: Bearish
Polkadot’s (DOT) resumed an uptrend as price rallied to $13.50 high but fails to breach the recent high. On July 20, the altcoin was in a downtrend as the crypto fell to the low of $10.51. The bulls bought the dips. Polkadot is now consolidating below the recent high. Buyers are facing stiff resistance at the $13.50 high. If buyers fail to penetrate the resistance zone, the downtrend will resume.
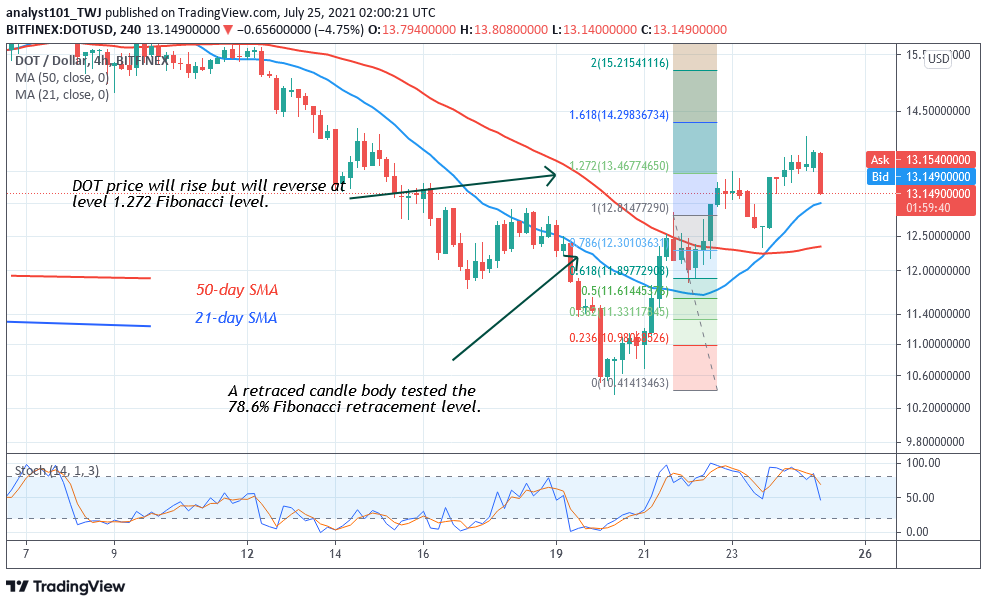
Sellers will again attempt to sink the DOT/USD below the previous low at $10.36.This will compel the altcoin to decline to $7.0. However, the selling pressure is expected as the crypto reaches the overbought region of the market. Meanwhile, on July 21 uptrend; a retraced candle body tested the 78.6% Fibonacci retracement level. The retracement indicates that the DOT price will rise but reverse at level 1.272 Fibonacci extensions or level $13.46. From the price action, the altcoin has tested the Fibonacci level and it is reversing. The crypto will reverse and return to the 78.6% Fibonacci retracement level where it originated.
LTC /USD Major Trend: Bearish
Following its breakdown on July 20, Litecoin plunged to $104.00 as bulls bought the dips. LTC’s price broke the previous low at $105.78 as the altcoin rebounded. The crypto rallied to $127 but the upward move was stalled at the recent high.
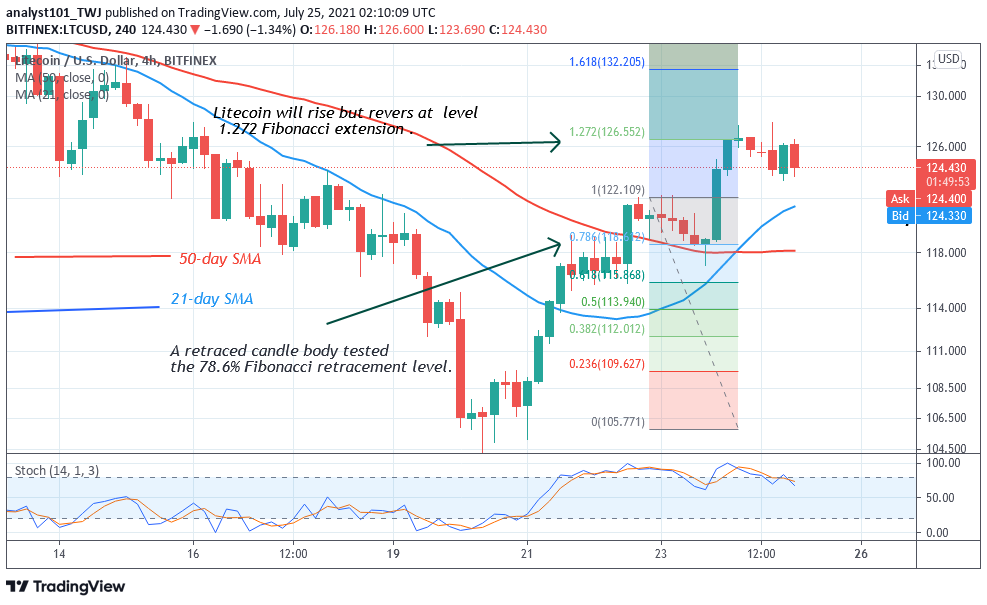
The altcoin recent rally has reached the overbought region of the market. The current bullish move is likely to terminate as the coin faces rejection at the recent high. Meanwhile, on July 21 uptrend; a retraced candle body tested the 78.6% Fibonacci retracement level. The retracement indicates that Litecoin is likely to rise but reverse at level 1.272 Fibonacci extension or level $126.55. From the price action, LTC price is facing rejection at the recent high. If LTC/USD price turns from the recent high, the bears will attempt to push Litecoin to the previous low at $105 or $104
LINK /USD Major Trend: Bearish
On July 20, Chainlink (LINK) fell to a new low at $13.43 as bears broke the previous low at $15.05. At the recent low of $13.43, the bulls bought the dips as LINK price rallied to a high of $17.13. The current upward move has reached the overbought region of the market.
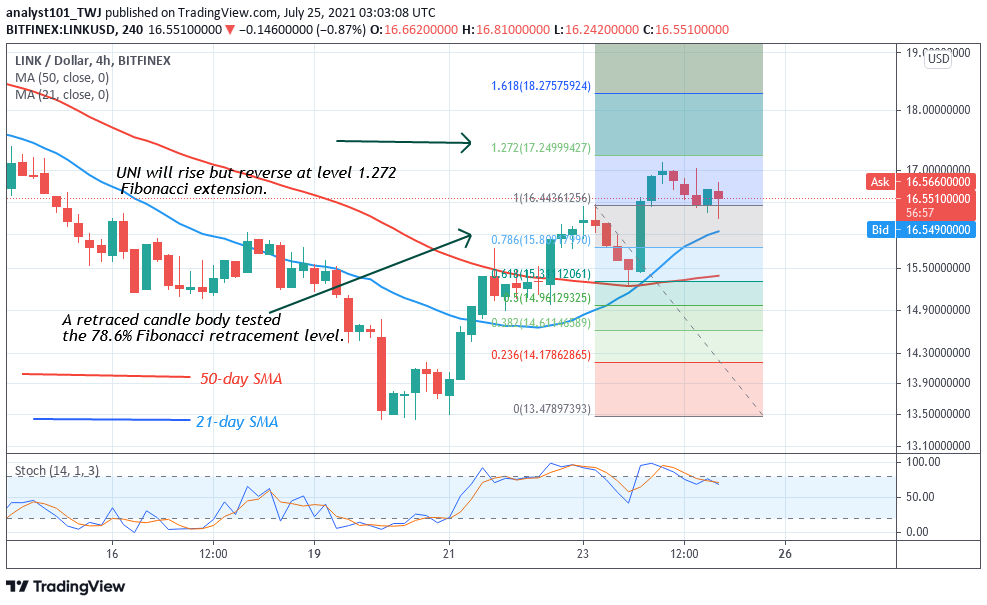
The crypto is presently facing resistance at the $17.13 high. The current upward move is doubtful as it faces rejection at the recent high. Meanwhile, on July 23 uptrend; a retraced candle body tested the 78.6% Fibonacci retracement level. This retracement indicates that the market will rise but will reverse at level 1.272 Fibonacci extensions or level $17.24. From the price action, Chainlink is reversing at the 78.6% Fibonacci retracement level.


