
Bitcoin and the other cryptos have declined to their previous lows. Further upward moves are being restricted below the 21-day line moving average. For upward moves, the cryptos must have a price rebound to break above their respective resistance levels. On the other hand, if the cryptos turn from the moving averages, the downtrend will resume this week.
BTC/USD Major Trend: Bearish
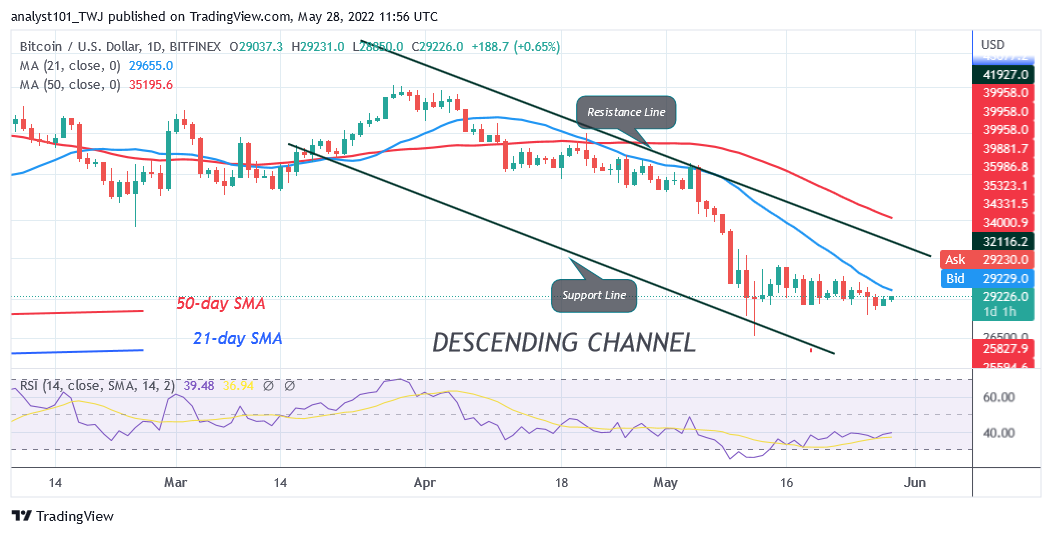
Bitcoin’s (BTC) price has declined above the $29,699 support. The upward move has been restricted below the 21-day line SMA. The bottom line is that Bitcoin will further decline to the previous lows if it failed to break above the 21-day line SMA. On the upside, if the BTC price rebounds above the $28,000 support, it will break above the 21-day line SMA. The bullish momentum will extend to the 50-day line SMA which is below the $40,000 psychological price level. Conversely, where buyers fail to break above the moving average, sellers will emerge to push prices down.
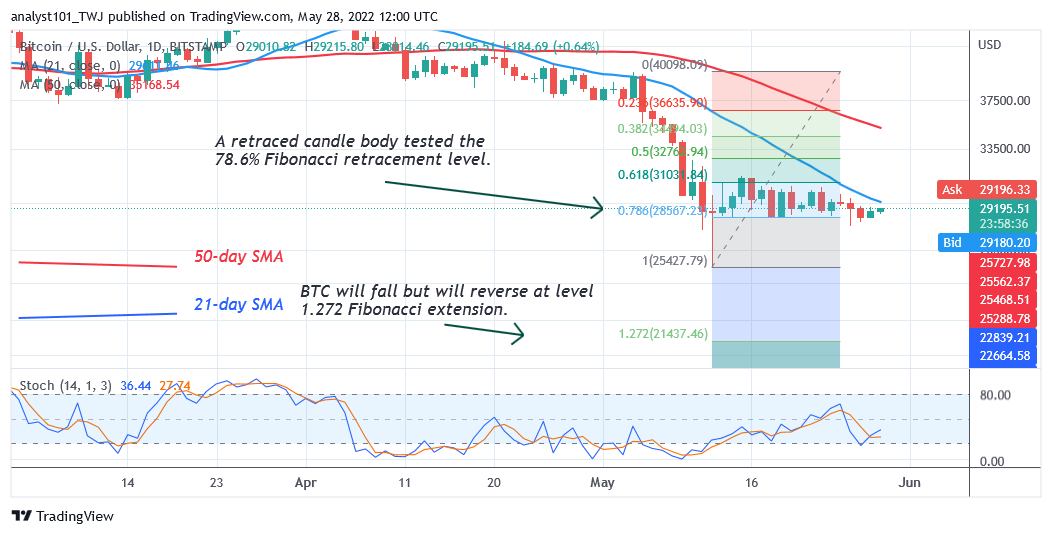
A break below the $28,000 support will cause the cryptocurrency to decline to the previous low of $26,591. Nonetheless, the crypto will further decline to $22,000 or $20,000 if the bears break below the $26,591 support. Meanwhile, on May 12 downtrend; a retraced candle body tested the 78.6% Fibonacci retracement level. The retracement indicates that Bitcoin will fall to level 1.272 Fibonacci extension or $21,437.
SAND/USD Major Trend: Bearish
The Sandbox (SAND) price is in a downward correction as price breaks below the moving averages. The upward correction was stalled below the 21-day line moving average.
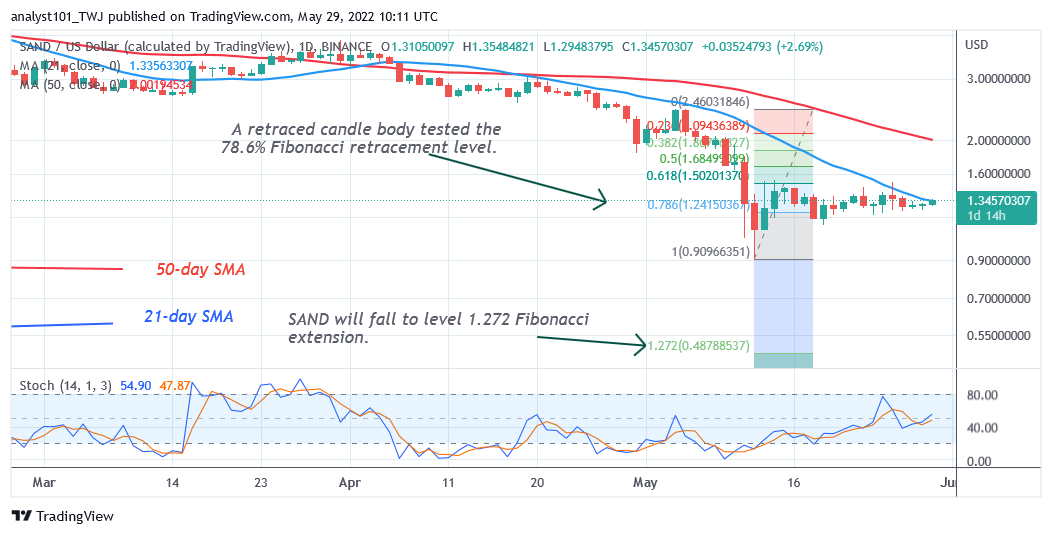
Further upward move is doubtful. On the upside, if SAND rebounds above the current support, the altcoin will break above the 21-day line moving average. The bullish momentum will extend to the 50-day line moving average which is below the $3.00 resistance level. However, if the coin turns from the moving average, the market will decline to the previous low at $0.90. Meanwhile, the altcoin is consolidating above the $1.13 price level. Nevertheless, on May 12 downtrend; a retraced candle body tested the 78.6% Fibonacci retracement level. The retracement indicates that the altcoin will fall but reverse at level 1.272 Fibonacci extension or $0.48 price level.
MANA/USD Major Trend: Bearish
Decentraland (MANA) is in a downtrend and has fallen significantly to the low of $0.90. Following the upward correction on May 15, the bulls have been battling to break above the 21-day line moving average.
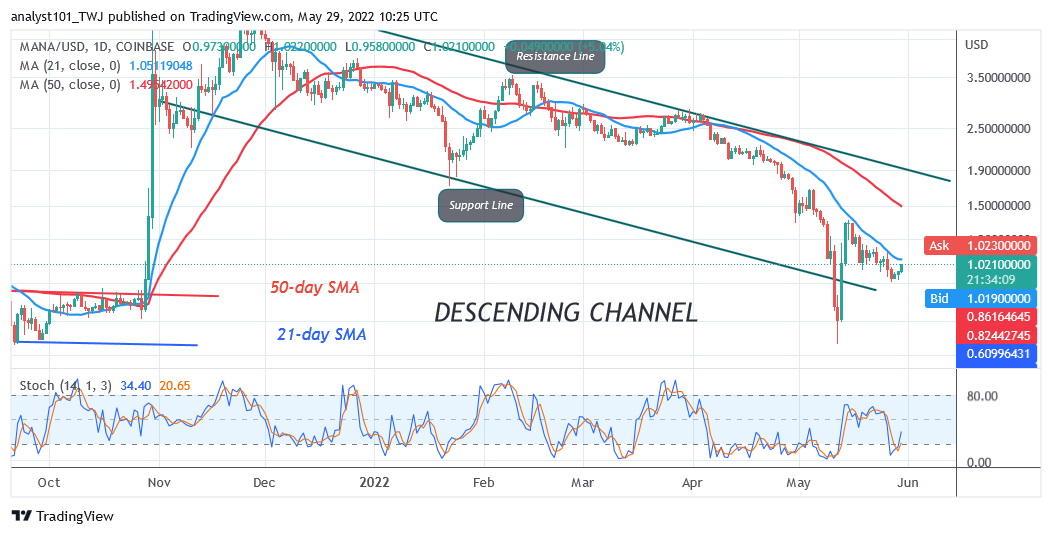
On May 16, the coin faced selling pressure at the $1.33 resistance level. Today, the coin may face another selling at the 21-day line moving if it fails to break above the recent high. Rejection will cause the coin to fall to the previous low at $0.59.On the other hand, a break above the 21-day line moving average will signal the resumption of the uptrend. The market will rise to the high of the 50-day line moving average which is below the $3.00 resistance level.
APE /USD Major Trend: Bearish
ApeCoin’s (Ape) price is in a downward correction as it revisits the previous low at $5.16. Buyers are attempting to push the altcoin above the 21-day line moving average.
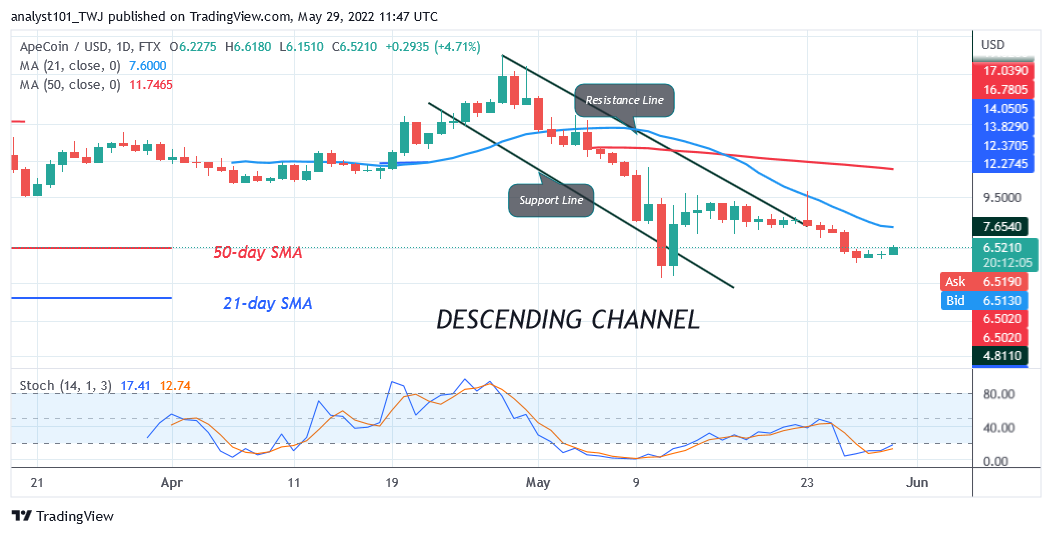
On May 23, buyers were repelled as they attempted to break above the 21-day line moving average. In the meantime, the coin is below the 20% range of the daily stochastic. ApeCoin has fallen to the oversold region of the market. Buyers are expected to emerge in the oversold region to push prices upward. On the upside, a break above the moving averages will catapult the altcoin out of a downward correction.
ENJ /USD Major Trend: Bearish
Enjin Coin (ENJ) is in a downward correction and the cryptocurrency has fallen significantly. The upward move of the coin has been restricted below the 21-day line moving average.
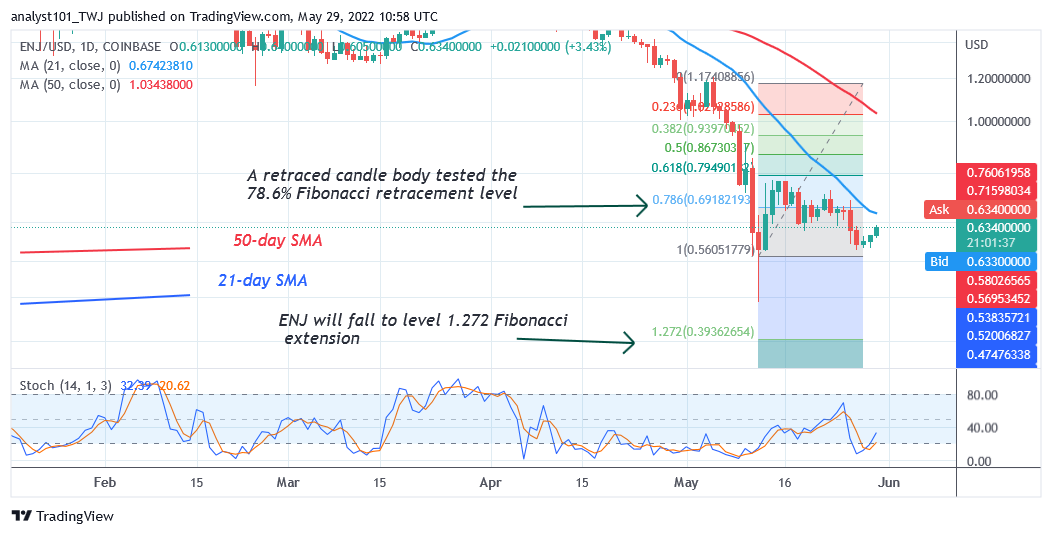
The downtrend will resume if the bears break below the $0.57 support. In the same vein, the uptrend will resume if the bulls break above the 21-day line moving average. Meanwhile, on May 12 downtrend, a retraced candle body tested the 78.6% Fibonacci retracement level. The retracement indicates that ENJ will fall to level 1.272 Fibonacci extension or $0.39.


