
Bitcoin and the other cryptos are making positive moves as buyers push the cryptocurrencies to the bullish trend zones. However, the cryptos are facing an overbought condition of the market. Sellers are likely to emerge to push prices downward. The uptrend will resume if the cryptocurrencies find support above the moving averages.
BTC/USD Major Trend: Bullish
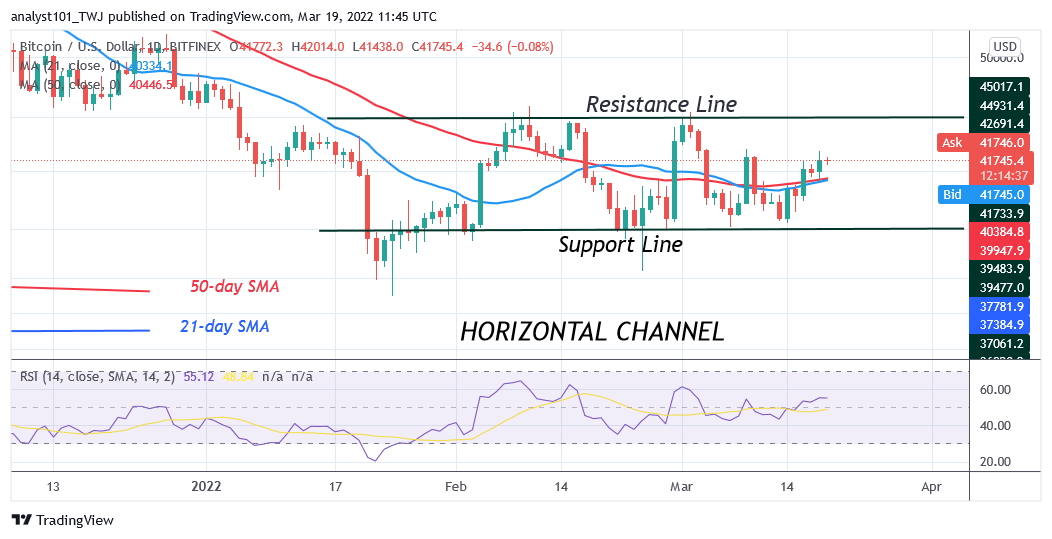
Bitcoin’s (BTC) price is trading in the bullish trend zone or above the moving averages. Since March 16, buyers have kept the price above the moving averages but the uptrend has been hampered at the $42,000 resistance zone. In the first uptrend on March 16, Bitcoin plunged sharply to the low of $38,878 as bulls bought the dips. BTC price corrected upward to $41,500 but was resisted again. On March 18 and 19, buyers are finding penetration difficult at the $42,000 resistance zone. Besides, the $42,000 resistance zone is an overbought region of the market. Sellers are selling at the resistance level at each rally. Sellers will emerge in the overbought region to push prices down.
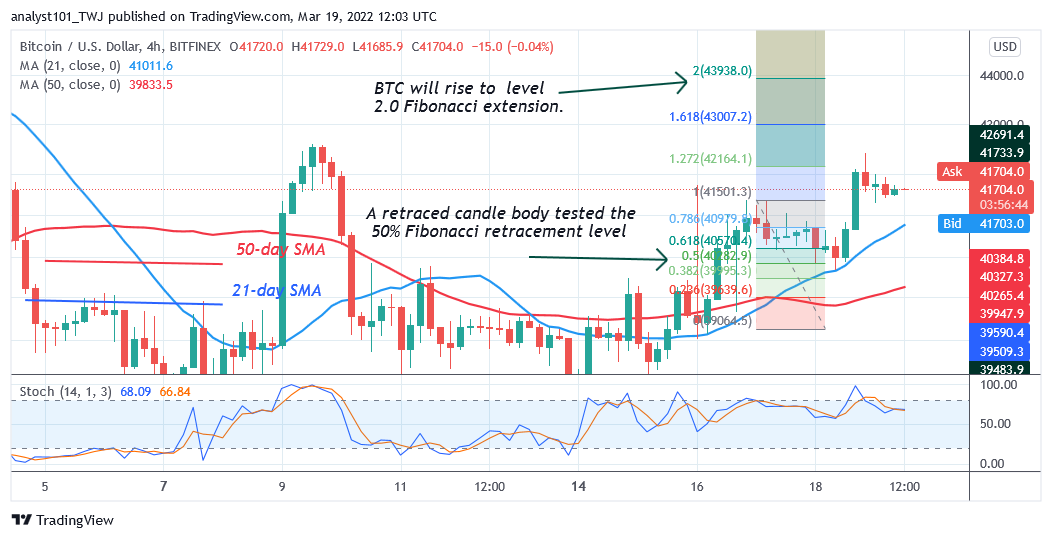
However, in a strong trending market, the overbought condition may not hold, BTC/USD will continue to rise to the previous highs. Meanwhile, in the lower time frame, BTC price is making a series of higher highs and higher lows. The initial resistance is likely to be broken if the BTC price rebounds below the resistance zone. On March 17 uptrend; a retraced candle body tested the 50% Fibonacci retracement level. The retracement indicates that BTC will rise to level 2.0 Fibonacci extension or level $43,938.
XRP/USD Major Trend: Bullish
Ripple’s (XRP) price is in an upward move as price breaks above the moving averages. On March 11, the bulls broke above the moving averages but the upward move has been restricted below the $0.80 high. Buyers have failed to keep the price above $0.80 as bears sold at each rally above the resistance.
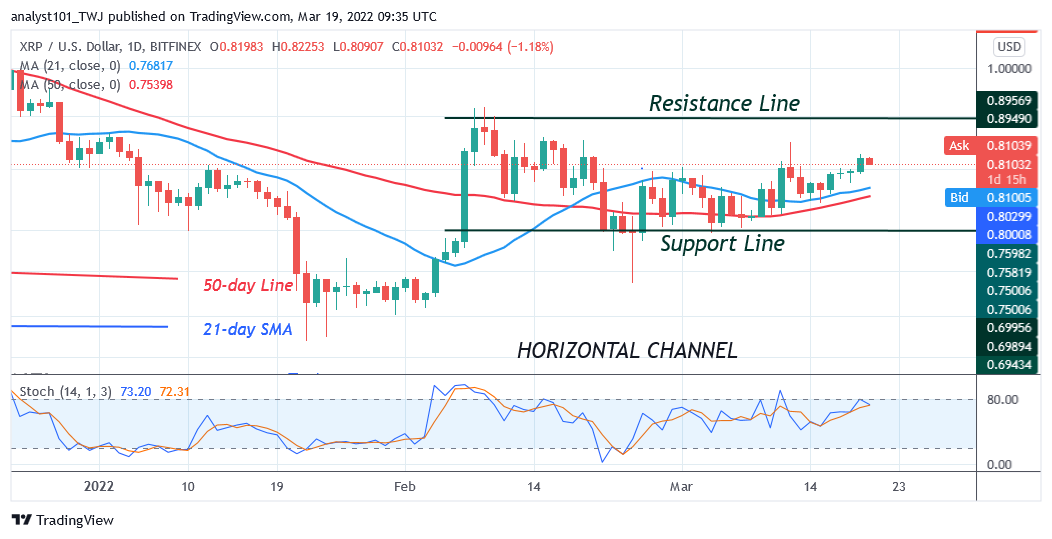
Meanwhile, XRP will retest the initial resistance as long as the price bars are above the moving averages. Since February 8, XRP/USD has been in a range-bound move between $0.70 and $0.90 price levels. On the upside, if the bulls breach the resistance at $0.80, a rally above the $0.90 resistance is likely. The bullish momentum will extend to the high of $1.00. XRP risks decline below the moving average if the bullish scenario is invalidated.
DOT/USD Major Trend: Bullish
Polkadot’s (DOT) price has resumed bullish momentum as price breaks above the moving averages. On March 16, the bulls broke above the moving averages as the altcoin continues its move to the previous high. However, the upward move is likely to be short-lived as the altcoin trades in the overbought region of the market.
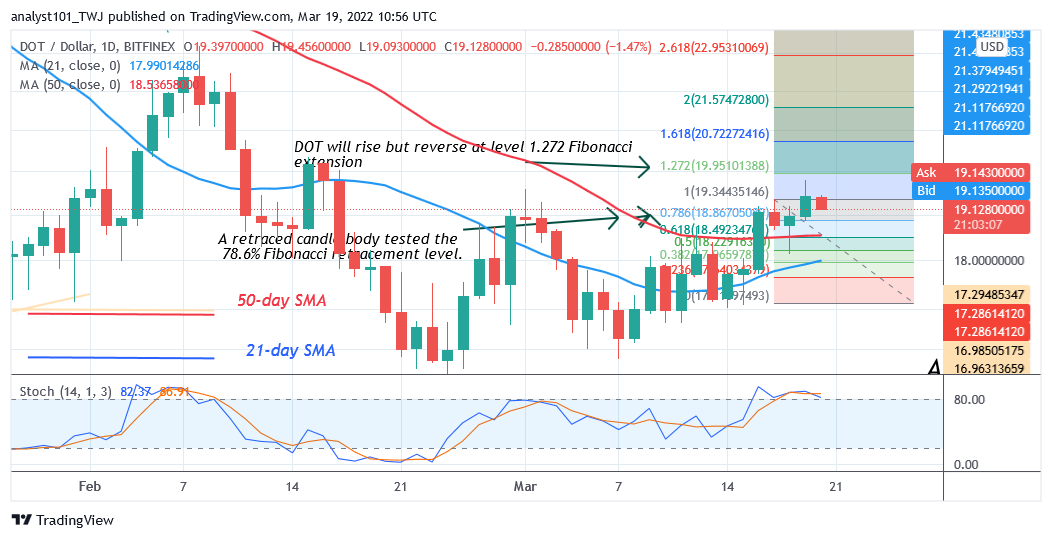
Meanwhile, on March 17 uptrend; a retraced candle body tested the 78.6% Fibonacci retracement level. The retracement suggests that DOT price will rise but reverse at level 1.272 Fibonacci extension or $19.95. From the price action, the DOT price has reached the high of $19.79 and it is retracing. The current retracement will extend to the low of $`18.86 where it originated. The uptrend is likely to be repeated if price found support above the moving averages.
LTC /USD Major Trend: Bullish
Litecoin’s (LTC) price has resumed bullish momentum as price breaks above the 50-day line moving average. The cryptocurrency has been in a range-bound move in between the moving averages for the past three days. Yesterday, the bulls broke above the moving averages as price reached the high of $117.35. Litecoin is trading in the overbought region of the market.
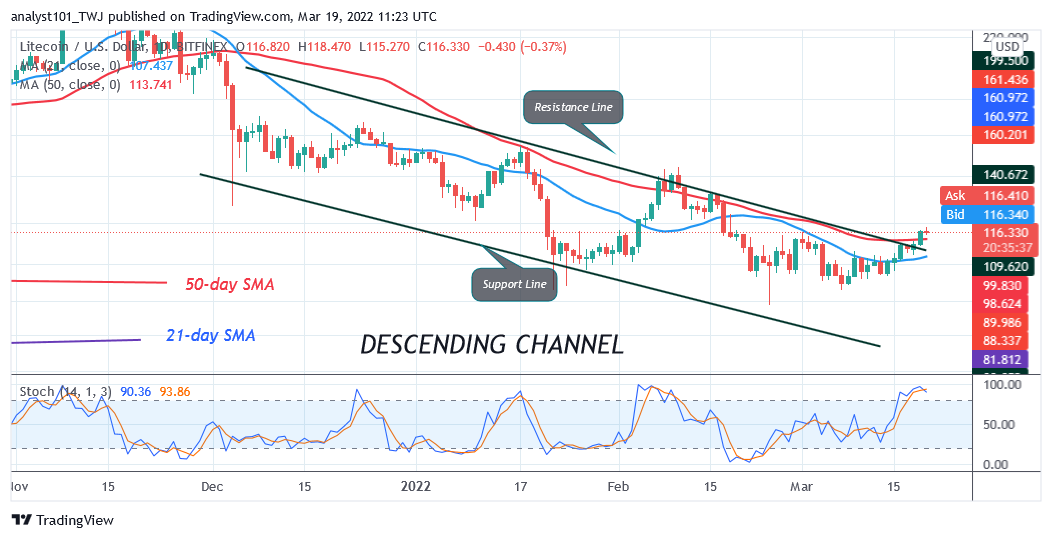
The current uptrend is likely to face rejection at the recent high as the market reaches the overbought region of the market. On the downside, Litecoin is likely to retrace to the low of $109.78 before a resumption of an upward move. Meanwhile, the LTC price is above the 80% range of the daily stochastic. It indicates that the market is overbought.
LINK /USD Major Trend: Bearish
Chainlink’s (LINK) price is in a downtrend as price breaks above the moving averages. The cryptocurrency has been in a range-bound move in between the moving averages. It is above the 21-day line moving average but below the 50-day line moving average. The bulls have failed to break above the 50-day line moving average.
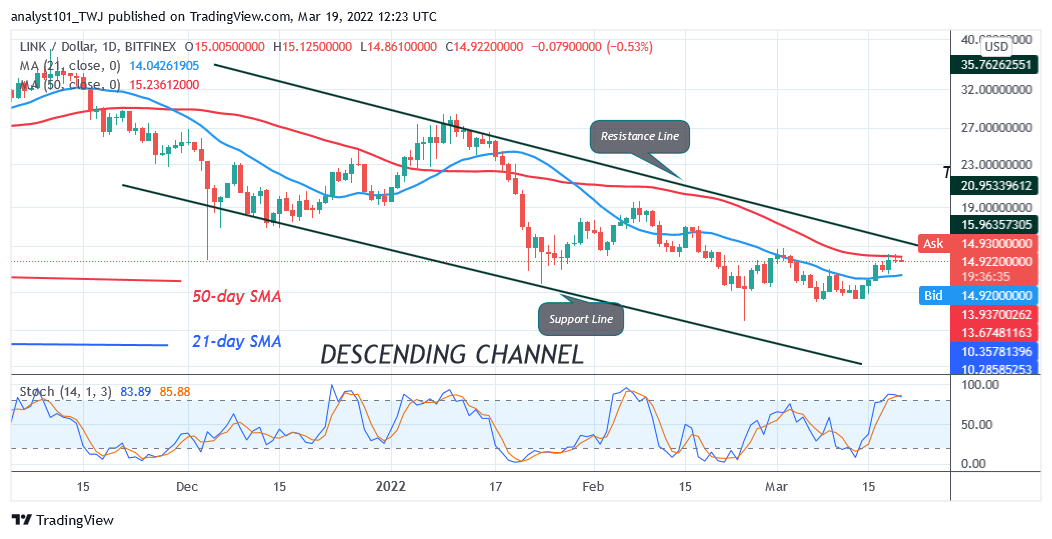
This indicates that the altcoin is likely to be range-bound for a few more days. Chainlink would have rallied to the highs of $17 and $19 price levels if price has broken above the moving averages. Nonetheless, the altcoin will trend when the moving average lines are breached. For instance, if price breaks above the 50-day line moving average, the LINK price will rally above $19 high. LINK/USD will decline to $13 low if price breaks below the 21-day line moving average.


