
For the past week, BTC/USD has been struggling to break above the $60,000 psychological price level. Buyers have been repelled twice at the resistance. A breakout may signal the resumption of upside momentum. The altcoins are in the bullish trend zone as bulls target to break the next resistance levels.
BTC/USD Major Trend: Bullish
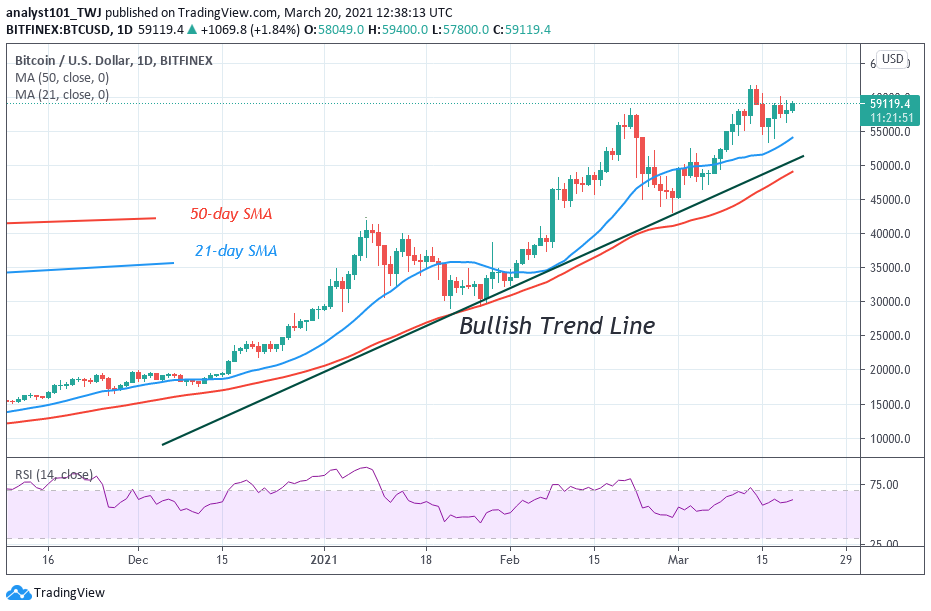
In the previous week, Bitcoin attained its current peak price of $61,699 on March 14. However, the uptrend was terminated as the BTC price reached the overbought region. The market has been in a downward correction after the rejection from the recent high. Last week, Bitcoin slumped to $54,000 low, and price corrected upward. The upward correction is facing another rejection at the $60,000 psychological price level. The Bitcoin bulls have retested the recent high thrice but could not penetrate the $60,000 high. On the upside, if the $60,000 resistance is breached, the BTC price will retest or break the next resistance at $61,000.
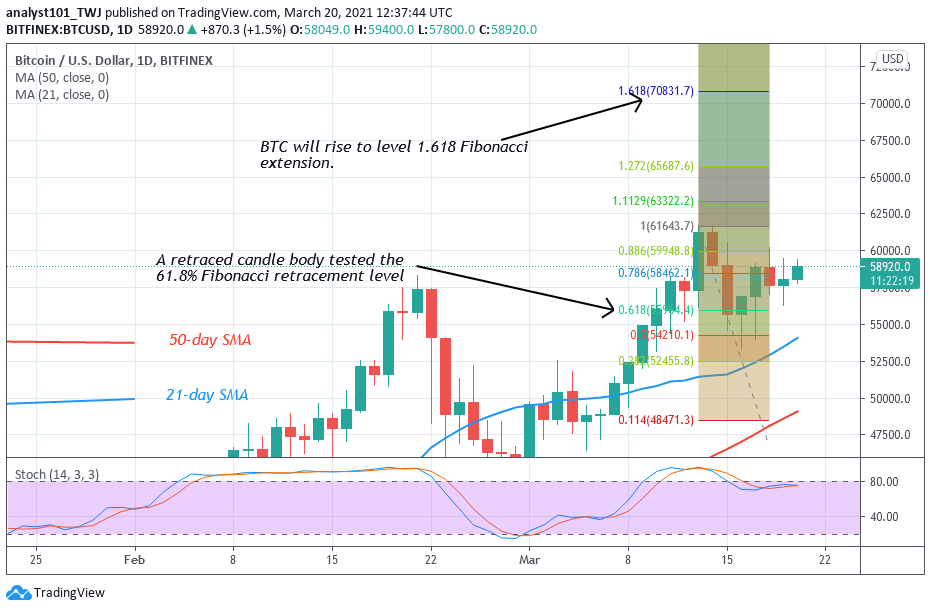
In the same vein, if the bulls clear the $61,000 resistance, the market will rise above $70,000 high. Nonetheless, the Fibonacci tool has indicated a possible move of Bitcoin. On March 13 uptrend; a retraced candle body tested the 61.8% Fibonacci retracement level. The retracement indicates that BTC price will rise to level 1.618 Fibonacci extension or the high of $70,831.70.40. This week, Bitcoin may attain a new high of $70,831
DOT/USD Major Trend: Ranging

Polkadot (DOT) fell to the $32 low after retesting the $40 overhead resistance. Since February 20, the overhead resistance has not been broken. For the past month, DOT has been ranged bound between $28 and $40. Today, DOT/USD is rising to retest the overhead resistance. If the bulls are successful above the overhead resistance, the uptrend will resume. According to the Fibonacci tool, the altcoin is likely to make a further upward move. On February 20 uptrend; a retraced candle body tested the 61.8% Fibonacci retracement level. This retracement implies that DOT will rise to level 1.618 Fibonacci extensions or the high of $57.93.
LTC /USD Major Trend: Bullish
Litecoin bulls have broken above the $200 resistance at the time of writing. However, the market difference is marginal. This is a positive move as it will propel the crypto to commence the resumption of the uptrend. On the upside, if the bulls scale above $200, LTC will retest $240 overhead resistance. This will catapult the coin to reach $300 high. Conversely, if the bulls fail to scale above the $200, there will be a repeat of the previous week’s price action. For the past week, Litecoin has been in a downward correction after the drawdown.
The bulls were unable to scale above the $200 resistance because of overwhelming selling pressure. The bears are defending above the $210 price level. As price breaks the $200 resistance, the uptrend will resume if the bullish momentum is sustained. On March 13 uptrend; a retraced candle body tested the 61.8% Fibonacci retracement level. The retracement indicates that LTC will rise to level 1.618 Fibonacci extension or the high of $276.28.
LINK /USD Major Trend: Bearish

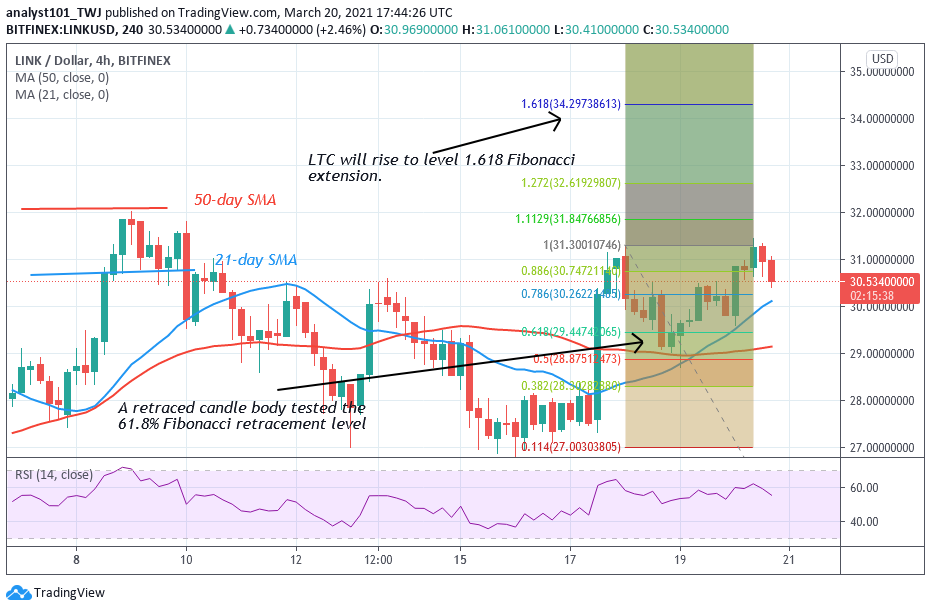
Following the breakdown on February 23, Chainlink plunged to $20.84 and pulled back. The bulls buy the dips as the crypto resumes upward. For the past month, buyers have been struggling to break above the resistance at $32.50. Chainlink has turned from the overhead resistance thrice without breaking it. LINK will rise to $34 if the bulls break the overhead resistance. Conversely, if the bulls fail to break the $32.50 resistance, LINK will decline to $20 low. On March 18 uptrend; a retraced candle body tested the 61.8% Fibonacci retracement level. The retracement indicates that LINK is likely to rise to level 1.618 Fibonacci extensions or the high of $34.29.


