
Bitcoin and the other cryptocurrencies have resumed downward correction as the cryptos faced rejection from their respective recent highs. The cryptos will regain bullish momentum if the overhead resistances are breached. Let us examine each of these coins.
BTC/USD Major Trend: Bearish
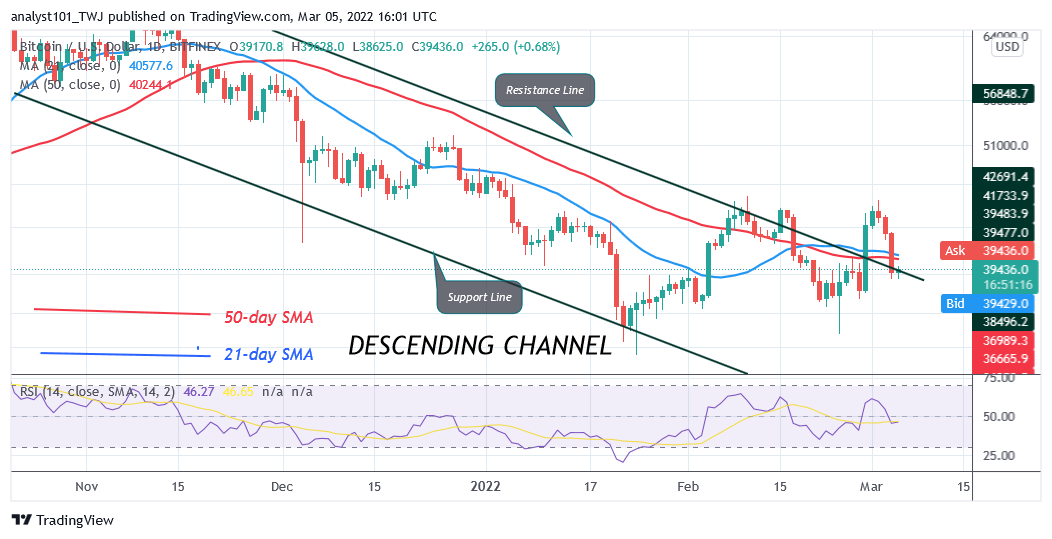
Bitcoin’s (BTC) price is trading in the bearish trend zone after buyers failed to keep the price above the $45,000 overhead resistance. Since February 10, buyers have made three unsuccessful attempts to break the $45,000 overhead resistance. Bitcoin will rally to the $50,000 psychological price level if the bulls clear the overhead resistance. Today, BTC/USD is trading at $39,464 at the time of writing.
BTC price has another chance of price rebound if the current support holds. The largest cryptocurrency will break above the moving averages and revisit the $45,000 overhead resistance. However, if the bears break below the $39,464 support, the market will decline to the low of $36,000 price level. Bitcoin is at level 49 of the Relative Strength Index for period 14. It indicates that there is a balance between supply and demand. Today, there are bullish candlesticks for a possible move of cryptocurrency.
XRP/USD Major Trend: Bearish
Ripple’s (XRP) price has fallen to the bearish trend zone. XRP price is above the 50-day line SMA but below the 21-day SMA. This implies that the XRP price is likely to be range-bound between the moving averages for a few more days. On the upside, if price breaks above the 21-day line SMA, XRP will rally to $0.90 resistance.
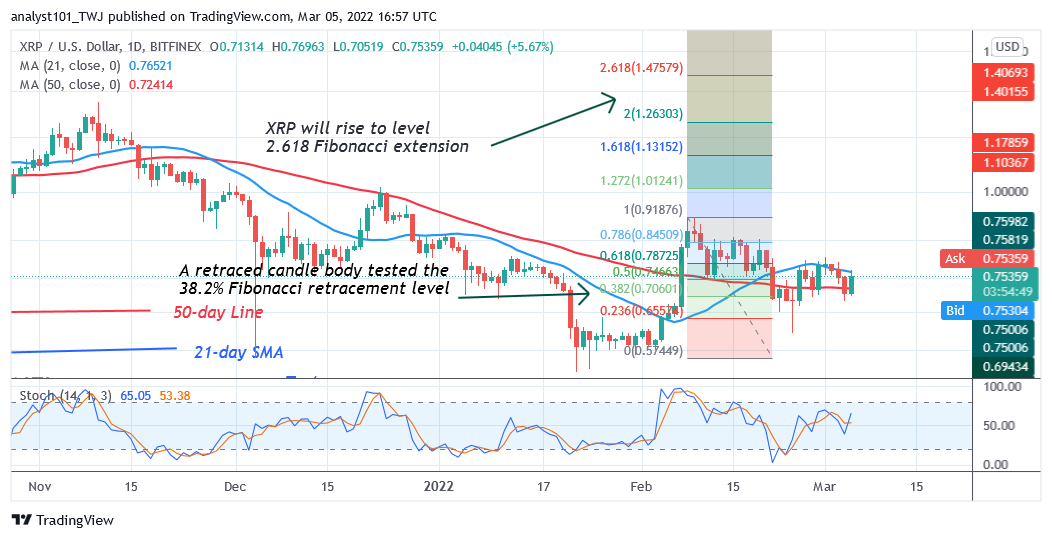
A break above the $0.90 resistance will catapult XRP above the $1.00 overhead resistance. Conversely, if the bears break below the 50-day line SMA, XRP will decline to $0.62 low. XRP is above the 50% range of the daily stochastic. The market is in a bullish momentum. XRP is trading at $0.75 at the time of writing. A price rebound above the $0.75 support will propel XRP to resume upside momentum.
DOT/USD Major Trend: Bearish
Polkadot’s (DOT) price is in a downward correction as price breaks below the moving averages. The cryptocurrency is prone to further decline as it is below the moving averages. On March 4, the bears broke below the 21-line moving average signaling the resumption of a downward correction.
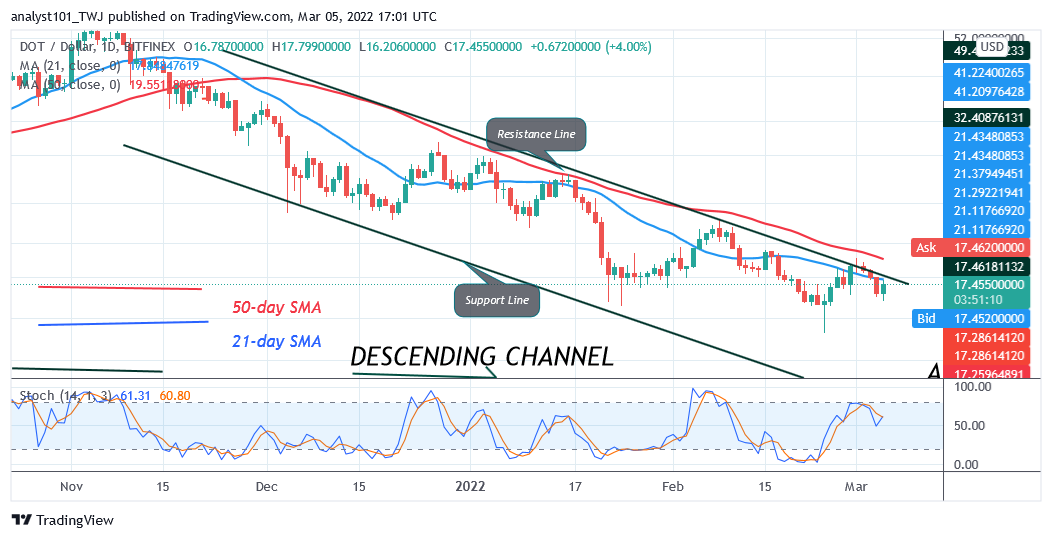
Since January 22, DOT/USD has been trading above the $15 support. Yesterday, the altcoin declined to $16.50 low and resumed upward. This implies that Polkadot will be fluctuating between $15 and $19 price levels. DOT/USD is trading at $17.45 at the time of writing. The upside momentum will resume if price breaks above the moving averages. The downtrend will resume if the DOT price turns from the moving averages.
LTC /USD Major Trend: Bearish
Litecoin’s (LTC) price is in a downward correction as price breaks below the moving averages. Following the January 22 price slump, LTC’s price has been trading above the $96 support. Buyers failed to keep the price above the moving averages. On February 10, Litecoin rebounded and rallied to the high of $144 but was repelled as the market reached an overbought region.
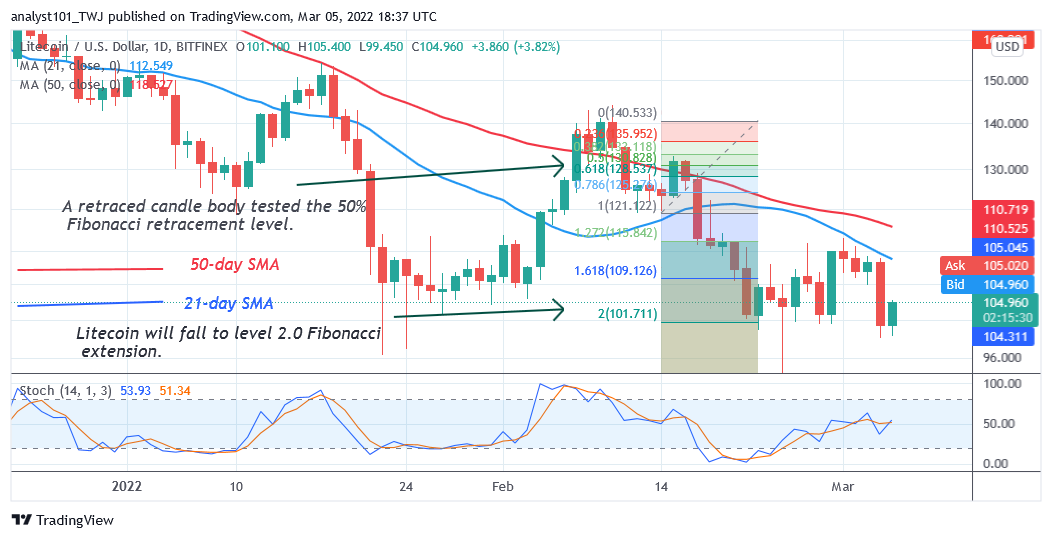
Today, LTC /USD has fallen to the previous low. Meanwhile, on February 14 downtrend; a retraced candle body tested the 50% Fibonacci retracement level. The retracement suggests that LTC will fall to level 2.0 Fibonacci extension or $101.71. From the price action, the LTC price is fluctuating above the 2.0 Fibonacci extension.
LINK /USD Major Trend: Bearish
Chainlink’s (LINK) price is in a downward correction as price falls below the moving averages. The cryptocurrency fell to the low of $13 which has been the crucial support level. Since January 22 price slump, the market has been fluctuating between $13 and $19 price levels.
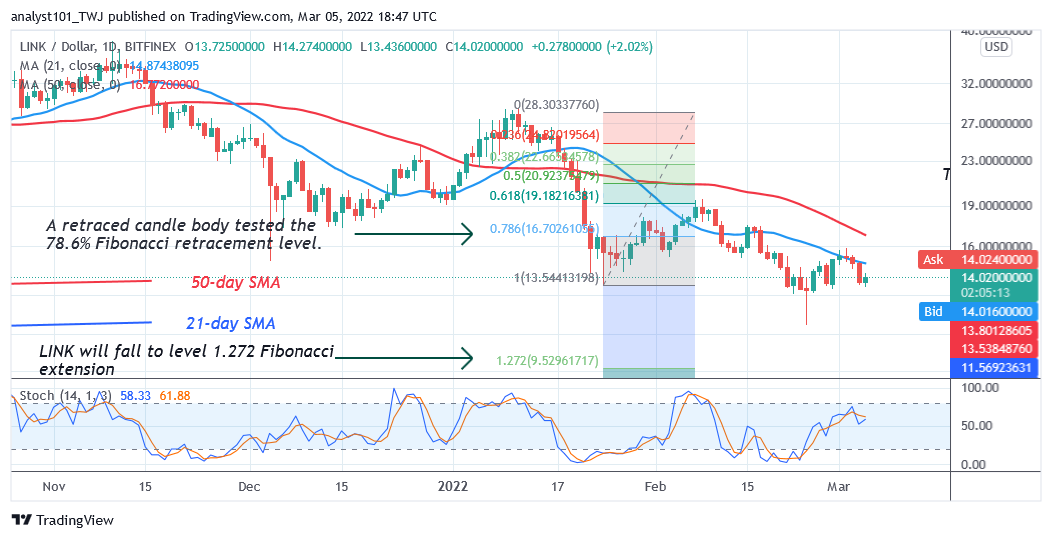
The bulls have not been able to keep the price above the moving averages. Each time the bulls break above the 21-day line moving average, Chainlink will fall and resume downward correction. On February 28 price rebound, the bulls broke the 21-day line moving average but were repelled at the $16 high. Chainlink declined sharply to the low of $13. Meanwhile, on February 24 downtrend; a retraced candle body tested the 78.6% Fibonacci retracement level. The retracement suggests that LINK will fall to level 1.272 Fibonacci extension or $9.52


