
Bitcoin and the altcoins are consolidating above their support levels. For the past week, the cryptos are presently defending their previous lows as the selling pressure subsides. The largest cryptocurrency and the altcoins will regain bullish momentum if the current support levels hold. However, if the bears break these current support levels, the downtrend will resume.
BTC/USD Major Trend: Bearish
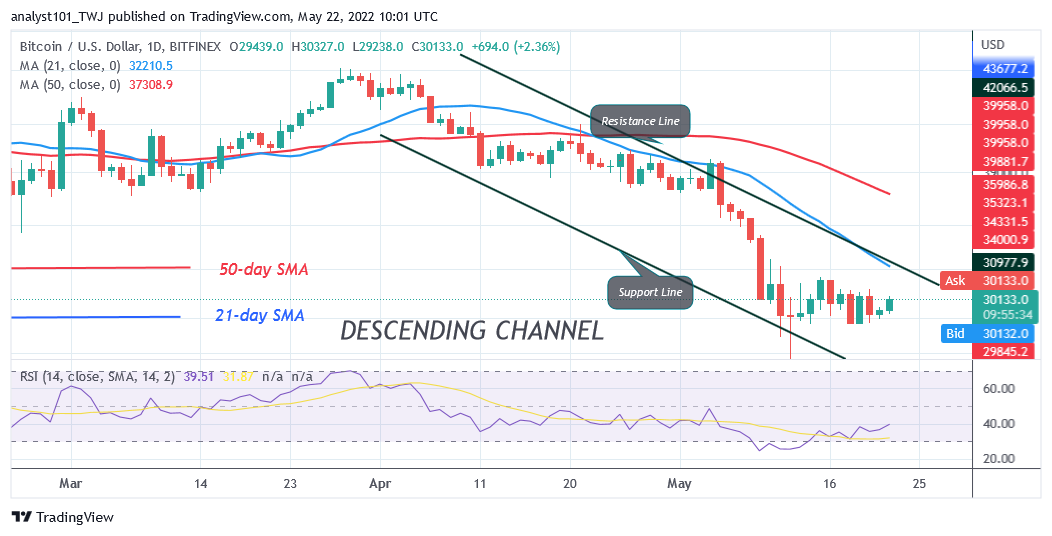
Bitcoin’s (BTC) price is in a downward correction but has resumed a sideways trend. Since May 12 price slump, the bearish trend has subsided as Bitcoin resumes a range-bound move. For the past week, BTC/USD has been fluctuating between $28,000 and $32,000 price levels. Today, the BTC price is making an upward move towards the $32,000 resistance zone. Bitcoin can also be repelled at the 21-day line moving. Since May 13, the bulls have had to defend the $28,000 crucial support. On the upside, if Bitcoin rebounds, the market will rally above the $32,000 resistance level. The bullish momentum will extend to the $40,000 psychological price level.
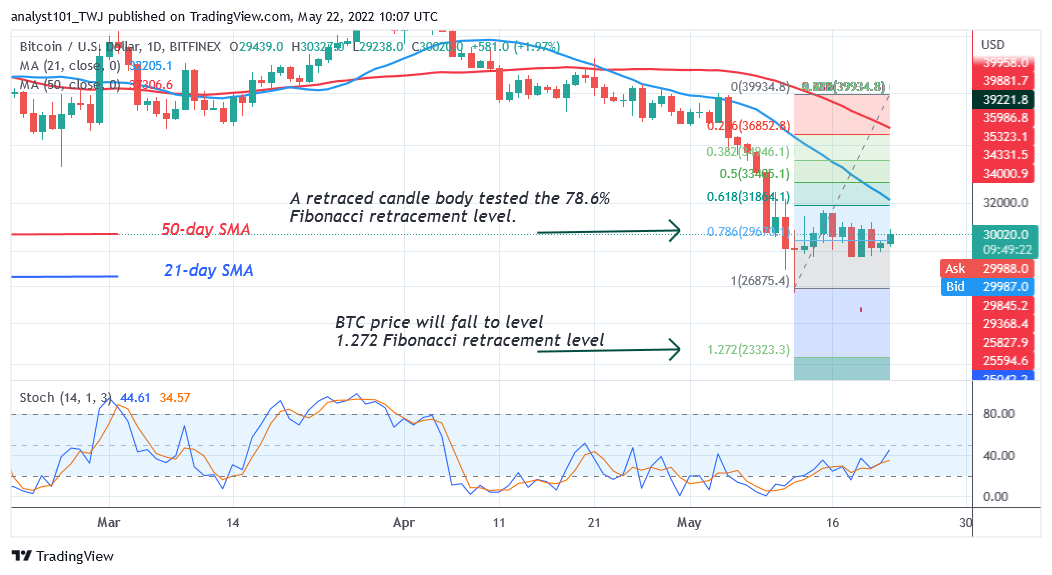
On the downside, if Bitcoin loses the $28,000 support, it will fall and revisit the previous low at $26,591. Meanwhile, on May 12 downtrend; a retraced candle body tested the 78.6% Fibonacci retracement level. The retracement indicates that BTC will fall but reverse at level 1.272 Fibonacci extension or $23,323.30. From the price action, Bitcoin is holding above the $28,000 support.
SAND/USD Major Trend: Bearish
The Sandbox (SAND) price is in a downtrend since November 2021. The cryptocurrency rallied to a high of $8.80 which is an overbought region. The selling pressure was caused by a bearish double top pattern. The downtrend has subsided as the altcoin fell to the low of $0.90 on May 12. The bulls bought the dips as SAND corrected upward.
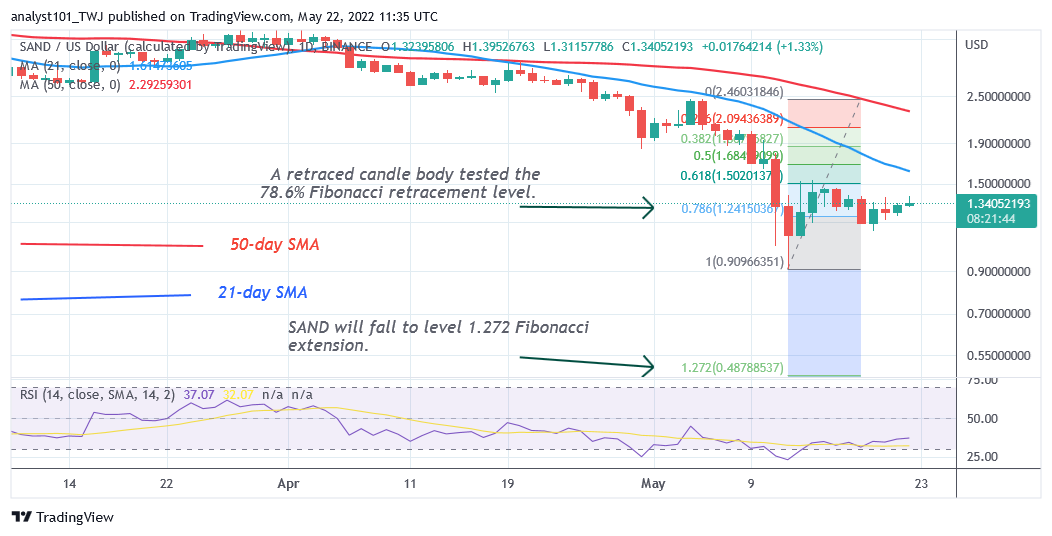
The upward correction was stalled at the high of $1.53. For the past week, the price fall has subsided as the market fluctuates between $1.10 and $1.50 price levels. On the downside, the SAND will resume a downtrend if the bears break below the $1.10 support. Meanwhile, on May 12 downtrend; a retraced candle body tested the 78.6% Fibonacci retracement level. The retracement indicates that the altcoin will fall but reverse at level 1.272 Fibonacci extension or $0.48 price level. In the meantime, SAND/USD is trading at $1.33 as of press time.
MANA/USD Major Trend: Bearish
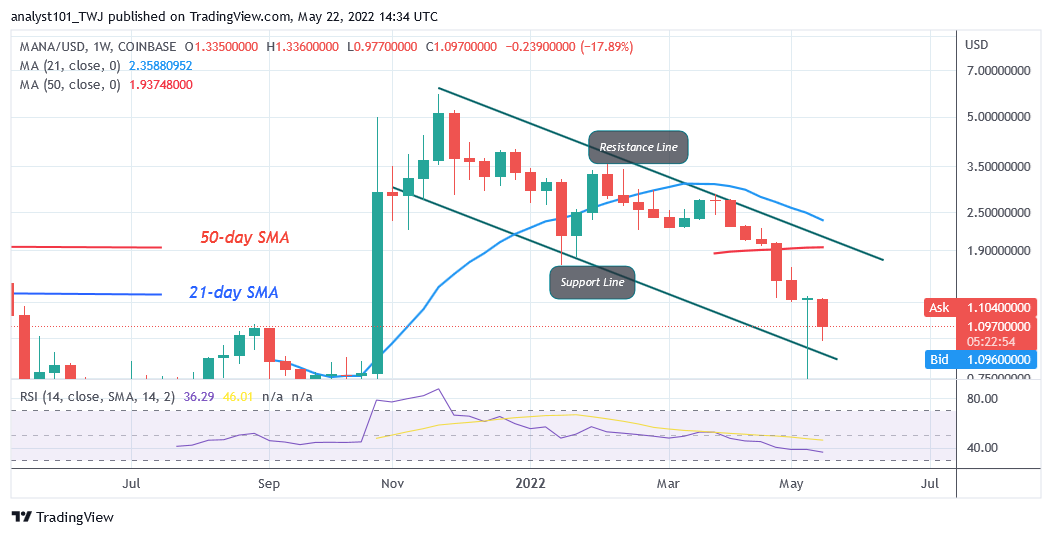
Decentraland (MANA) is in a downward move since November 2021. The cryptocurrency rallied to the high of $5.19 but was repelled as the market reached an overbought region. The selling pressure has resumed as price broke below the moving averages. The altcoin has fallen to the low of $0.97 on May 16. On May 19, a candlestick dropped sharply to the low of $0.75 and pulled back. The long candlestick tail is pointing to the support above the $0.67 price level. It indicates that the current support has strong buying pressure.
APE /USD Major Trend: Bearish
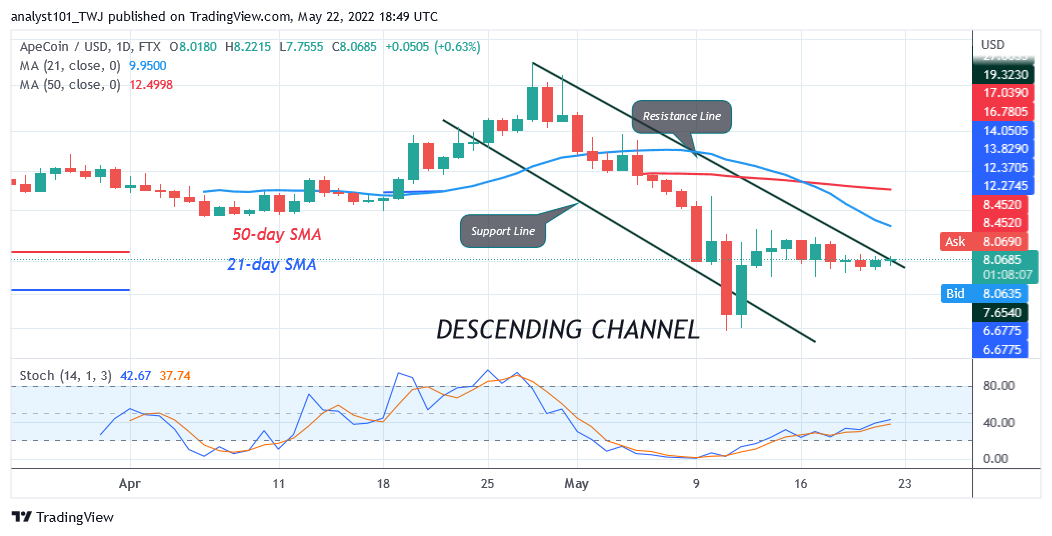
ApeCoin’s (Ape) price is in a downtrend as it broke below the moving averages. In its April uptrend, the coin reached the overbought region at $27 but could not sustain the bullish momentum. Sellers emerged to push prices downward. The cryptocurrency fell to a low of $5.16 as bulls bought the dips. The current decline reached an oversold region of the market. Buyers have emerged to push prices upward. On the upside, if the altcoin rebounds above the current support, the market will rally above the moving averages. This will propel the coin to revisit the previous high of $27. The coin is above the 40% range of the daily stochastic. It is in a bullish momentum.
ENJ /USD Major Trend: Bearish
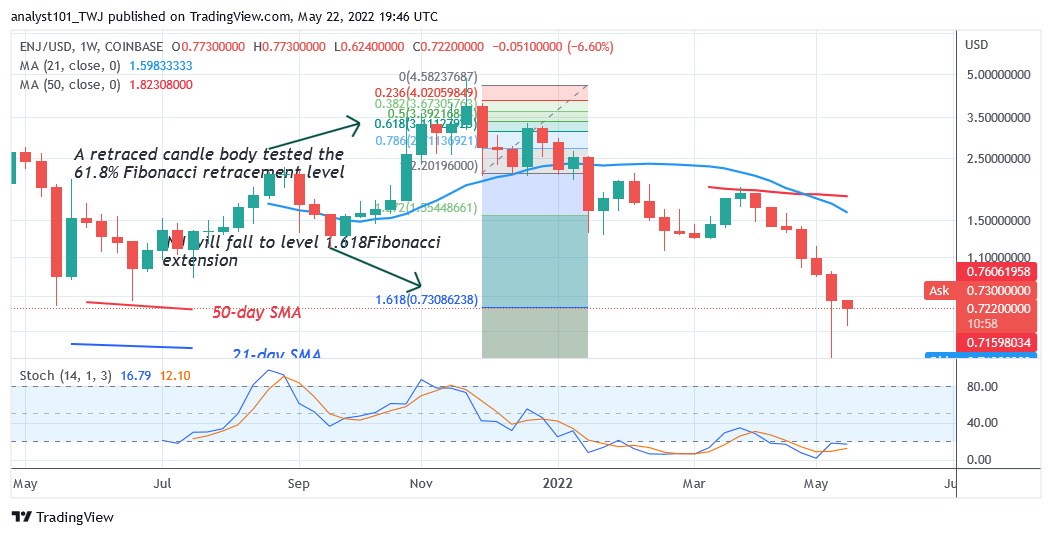
Enjin Coin (ENJ) is in a downtrend as price breaks below the moving averages. The cryptocurrency fell to the low of $0.46 as bulls bought the dips. The altcoin is now below the 20% range of the daily stochastic. The altcoin has fallen to the oversold region of the market. Further selling pressure is unlikely. Meanwhile, on the weekly chart, a retraced candle body tested the 61.8% Fibonacci retracement level on December 20. The retracement indicates that ENJ will fall to level 1.618 Fibonacci extension or $0.73. From the price action, ENJ has retested level 1.618 Fibonacci extension as it resumed upward.


