
Bitcoin and other cryptocurrencies are now located at the bottom of the chart after the recent downward trend. On November 6, the overhead resistance rejected Bitcoin and other cryptocurrencies resulting in the current downtrend. The cryptos will continue to fall this week as they get closer to oversold areas.
BTC/USD Major Trend: Bearish
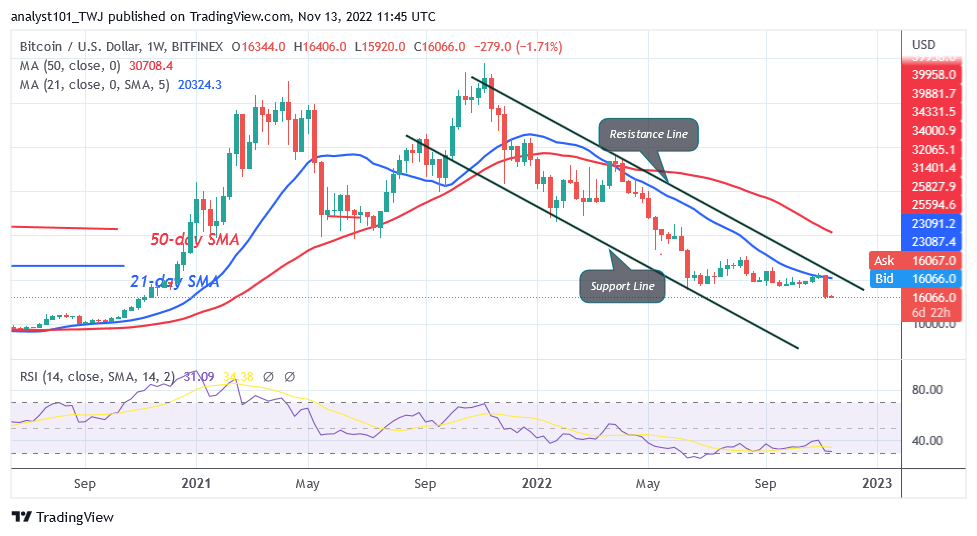
Bitcoin’s (BTC) price is on a downward trend as it gets closer to the $15,503 support level. The largest cryptocurrency fell to a low of $15,588 on November 9 as bulls purchased the dips. Although it made a brief upward correction, Bitcoin was stopped at the high of $18,150. Today, sellers are once again applying selling pressure as they go back to the $15,503 support level. Bitcoin will decline but then rise over the $15,500 support level. In contrast, if the present support is broken, Bitcoin will fall but turn around at the following support.
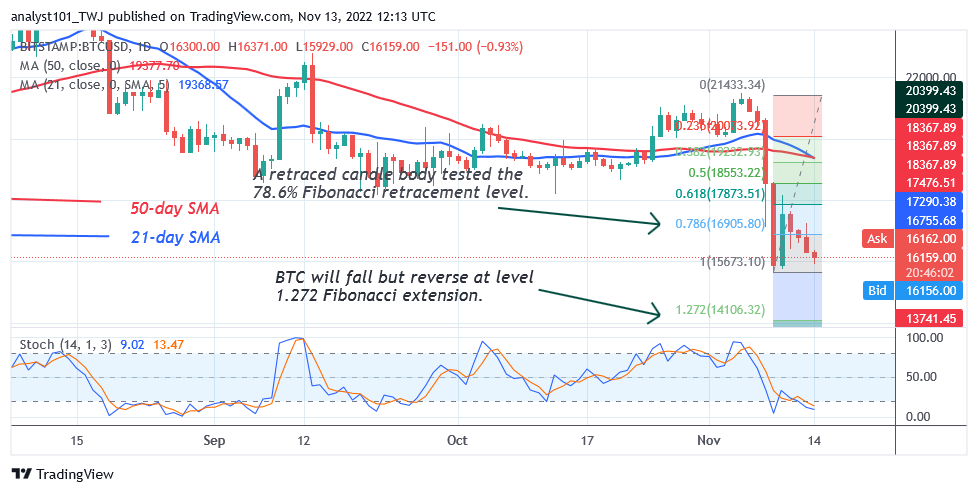
BTC price corrected upward during the decline of November 9 and a candle body tested the 78.6% Fibonacci retracement level. According to the correction, BTC will decline but turn around at the level of the 1.272 Fibonacci extension, or $14,106.32. Currently, Bitcoin is below the daily Stochastic’s level 20 and in the oversold area. As buyers started to appear, the selling pressure approached the oversold area.
SAND/USD Major Trend: Bearish
The Sandbox (SAND) has picked up the selling pressure after encountering resistance at the $1.00 level. Bulls purchased the dips as the cryptocurrency fell to a low of $0.55.
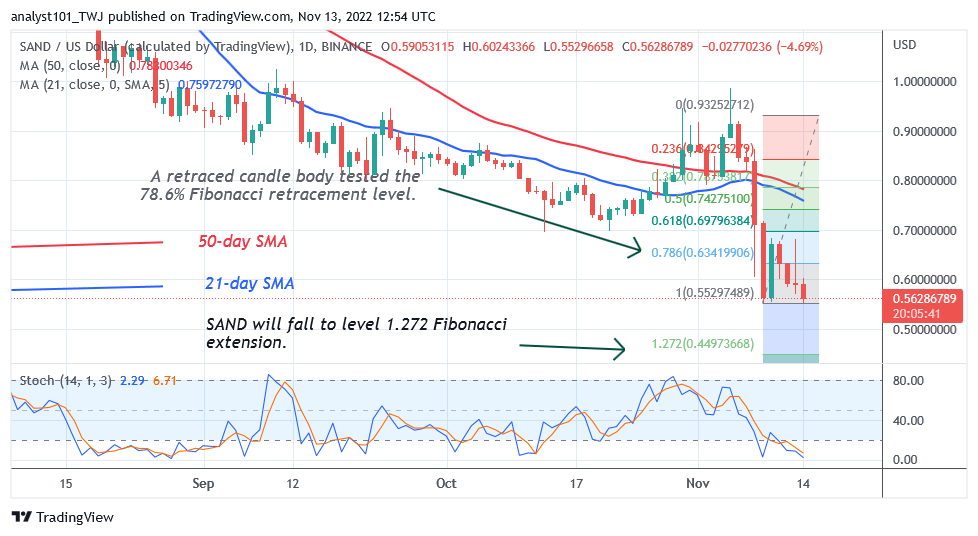
The altcoin is failing to violate the existing support, repelling the upward correction. During the downward trend on November 9, SAND made an upward correction, and a candle body tested the 78.6% Fibonacci retracement line. According to the correction, SAND will drop but then rise to the level of the 1.272 Fibonacci extension, or $0.44. The coin is currently below the daily Stochastic threshold of 20. The oversold area has been reached by the cryptocurrency. Bearish weariness has been achieved with the selling pressure.
MANA/USD Major Trend: Bearish
The Decentraland (MANA), which is still declining below the moving average lines, is in a downtrend. On November 9, MANA fell to a low of $0.44 before recovering.
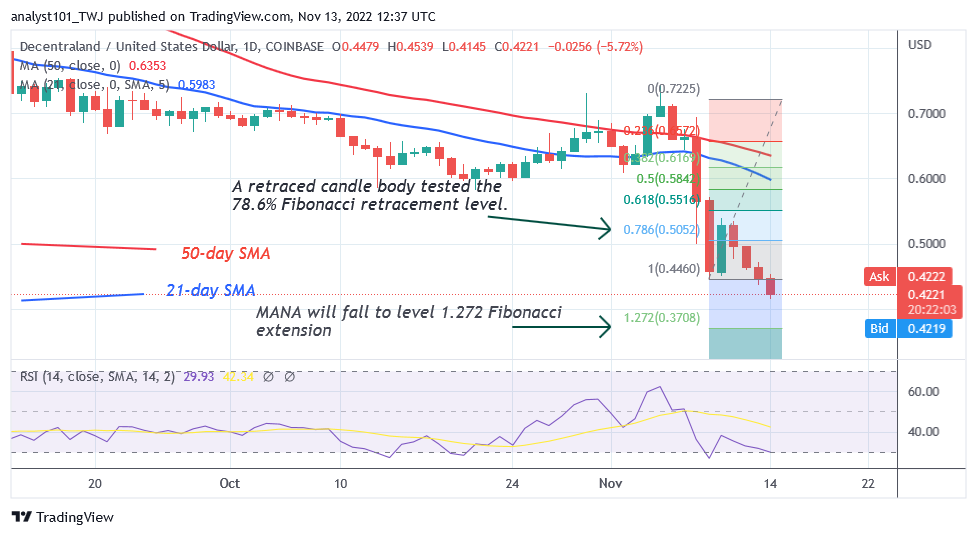
The current support was broken by the bears, which renewed the selling pressure. During the downward correction on November 9, MANA tested the 78.6% Fibonacci retracement level with a candle body. According to the correction, MANA will decline but turn around the level of the 1.272 Fibonacci extension, or $0.37. It is at level 29 on the Relative Strength Index for period 14. It shows that MANA has entered the market’s oversold area. In the oversold area, buyers will show up to drive prices up.
APE /USD Major Trend: Bearish
Apecoin (APE) price is on a downward trend after being rejected from the $0.70 barrier zone. Due to its rejection, the cryptocurrency is currently declining.
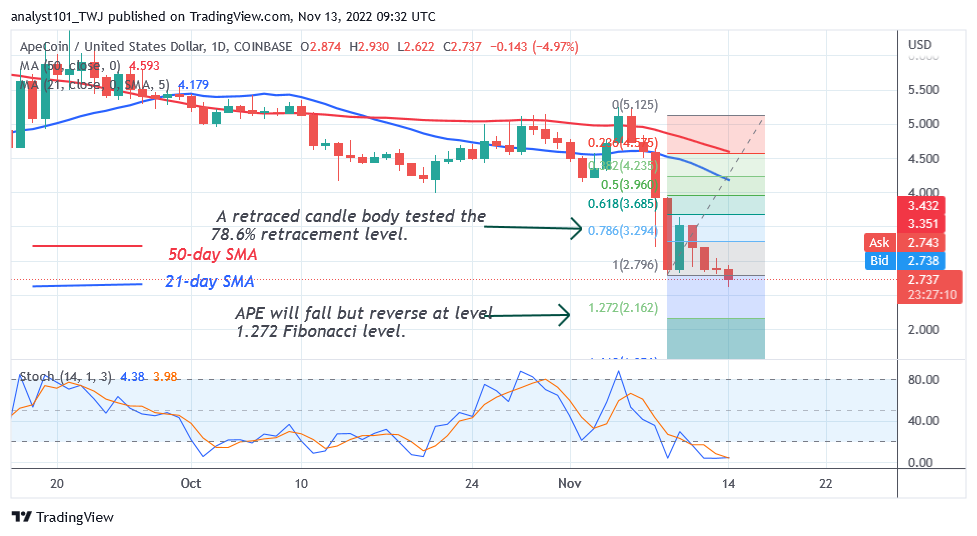
On the downward trend that began on November 9, APE made an upward corrective, and a candle body tested the 78.6% retracement line. The correction predicts that APE will fall but reverse course at level 1.272 of the Fibonacci sequence, or $2.16. The altcoin has plummeted below level 20 and entered the oversold region as compared to the daily Stochastic. Lower price points are perhaps more likely to draw buyers.
ENJ /USD Major Trend: Bearish
Enjin Coin (ENJ) is in a downtrend as the altcoin encounters resistance from the $0.50 high. The altcoin fell to a low of $0.31 and has since experienced further selling pressure.
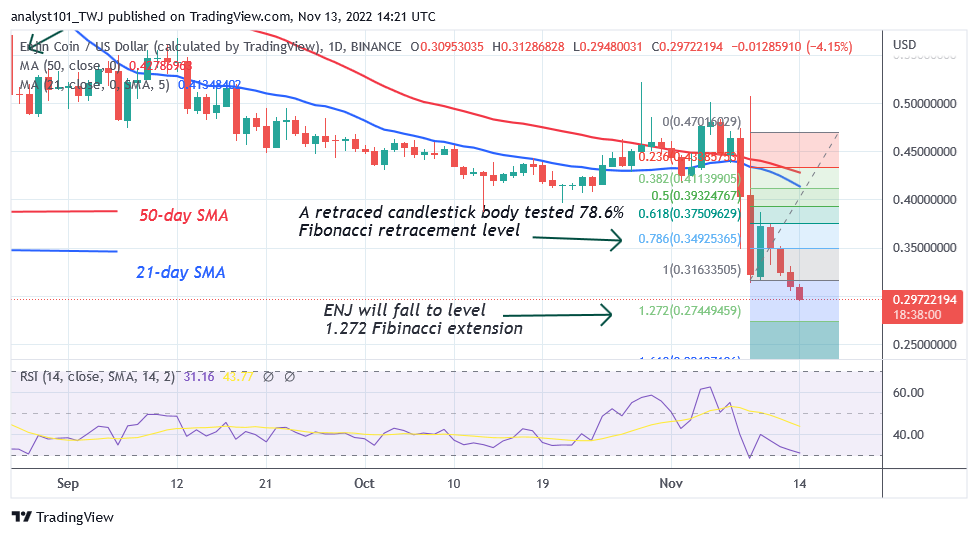
On the downward trend of November 9, ENJ made an upward correction, and a candle body tested the 78.6% Fibonacci retracement line. Following the correction, ENJ is expected to decline or reverse at the price of the Fibonacci extension, or $0.27. At level 31 of the Relative Strength Index Period 14, the cryptocurrency is in a steady decline. It is getting close to the market’s oversold area.


