
Since buyers drove the cryptos over the moving average lines, Bitcoin and the altcoins have experienced unusual price fluctuations. The cryptos have returned to their prior levels, reversing the recent bullish movements. Nevertheless, at their respective highs, the cryptocurrencies encountered strong opposition. However, as the coins retrace above or between the moving average lines, they can be forced to trade in a range.
BTC/USD Major Trend: Bullish
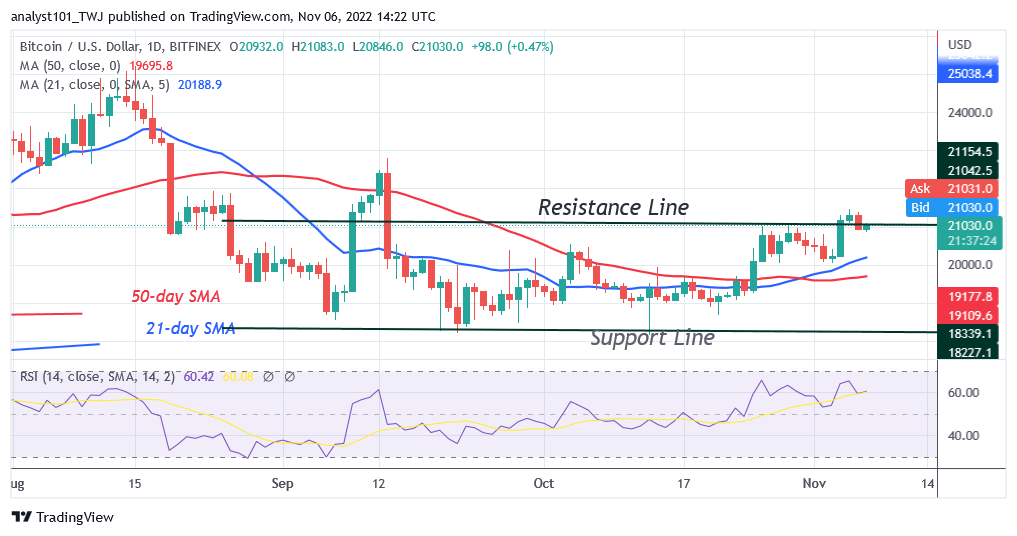
Bitcoin’s (BTC) price retraces after breaking through the barrier at $21,022. The biggest cryptocurrency increased its price to a high of $21,470 before retreating over the breaking point. BTC price has returned to price action from November 4. The largest cryptocurrency hit a low of $20,078 on November 2. On November 4, BTC’s price made a comeback and surpassed the current resistance level. On the plus side, if the current trend continues, Bitcoin will rise to the next resistance level of $22, 794.
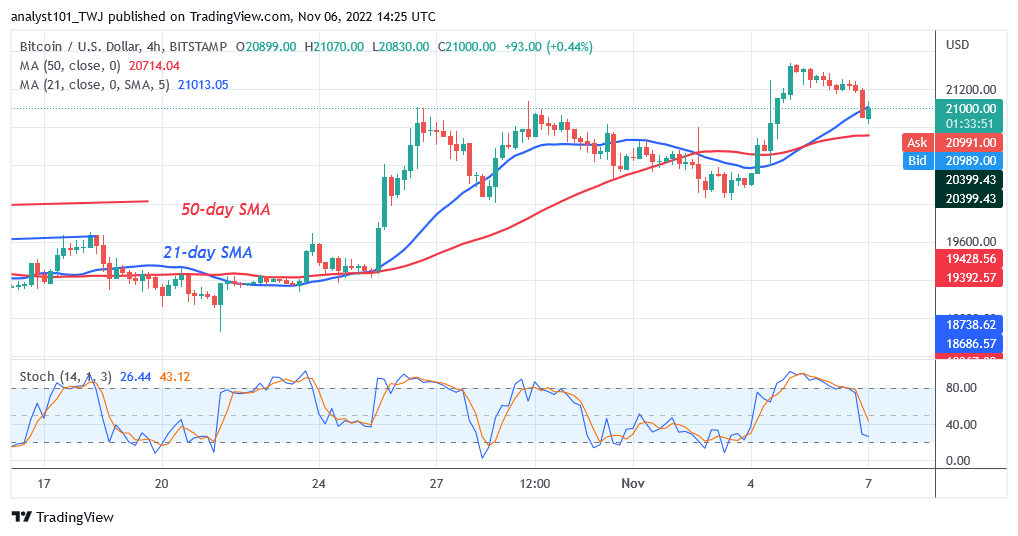
However, the Relative Strength Index for period 14 indicates that Bitcoin is approaching the overbought region of the market. The likelihood that the current bullish trend will test or surpass the next resistance level is minimal. BTC price will find support higher if it drops from the $22,000 resistance zone.
SAND/USD Major Trend: Bullish
The Sandbox (SAND) has broken above the moving average lines and is now on an upward correction.
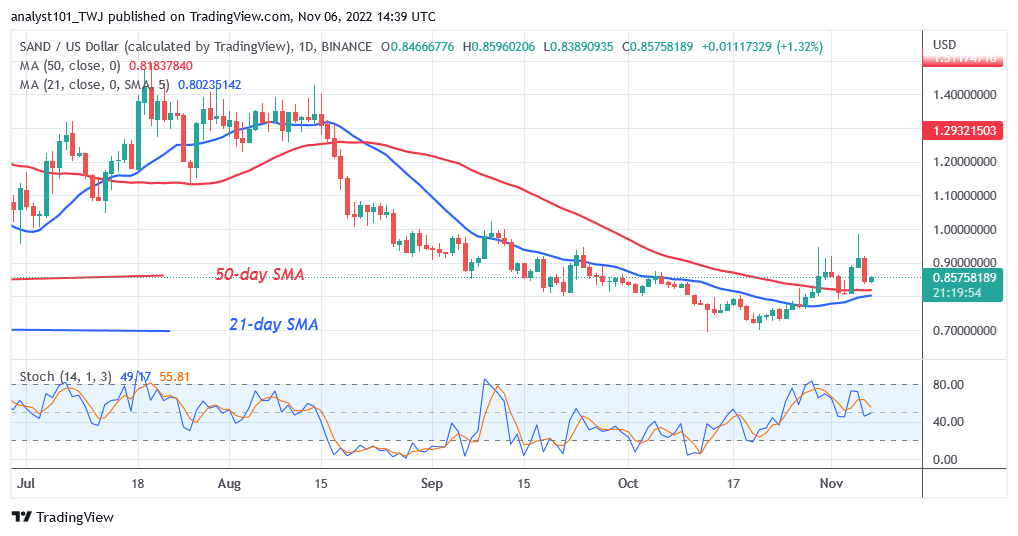
The altcoin rose to a high of $0.94 before declining. Today, the altcoin is resuming its upward movement by consolidating above the moving average lines. The Sandbox has the potential to rise to its prior high of $1.40 but runs the risk of falling. As it was trading in an overbought area, The Sandbox fell. The coin is currently above the daily Stochastic’s 40% range. The cryptocurrency is now again moving upward.
MANA/USD Major Trend: Bullish
The Decentraland (MANA) has broken above the moving average lines and is now on an upward correction.
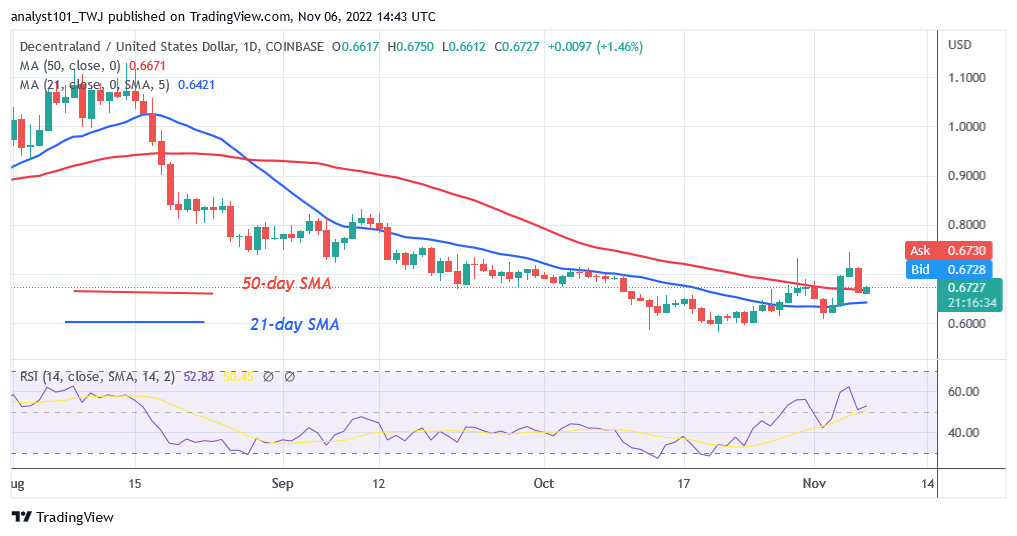
The coin climbed as high as $0.73 before declining. If the cryptocurrency retraces below the 50-day line SMA, it will be forced into a range-bound trend. In a similar vein, if the 50-day line SMA support holds, the bullish trend will pick up again. The Relative Strength Index for period 14 has MANA at level 50. It suggests that the forces of supply and demand are in equilibrium.
APE /USD Major Trend: Bullish
ApeCoin (APE) is correcting upward, although it is constrained by the moving average lines.
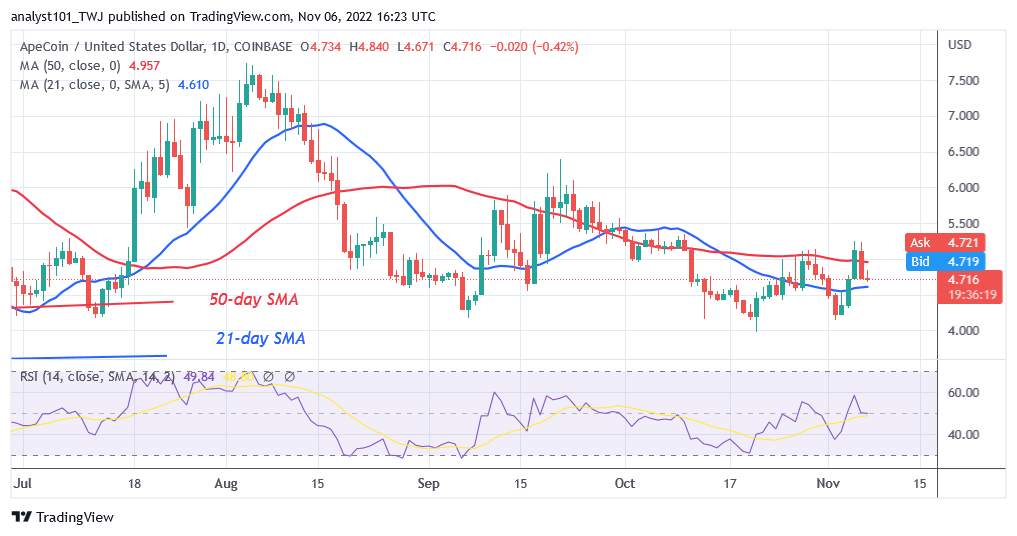
The moving average lines have not changed as the cryptocurrency has maintained its horizontal movement. If the price rises over the 50-day SMA, the upward movement can resume. The altcoin is trading in a range, as indicated by the moving average lines. At level 51 of the Relative Strength Index for period 14, APE is in the uptrend zone. It suggests that the forces of supply and demand are in equilibrium.
ENJ /USD Major Trend: Bullish
Enjin Coin (ENJ) has broken above the moving average lines, indicating that it is on an upward correction. The altcoin, however, retraced above the moving average lines, stopping the upward movement.
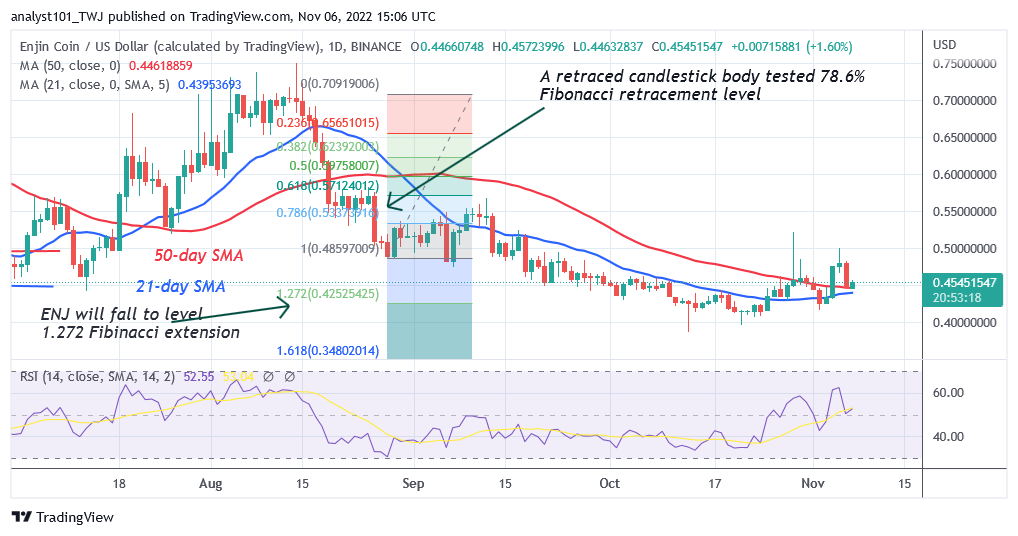
The present downward trend has achieved bearish exhaustion, says the price indicator. ENJ made an upward reversal on the downtrend that began on August 28 and a candle body tested the 78.6% Fibonacci retracement line. The correction predicts that ENJ will fall or reverse at the level of the Fibonacci extension 1.272, or $0.42. The bulls surpassed the moving average lines on October 29 and hit a high of $0.52. But ENJ experienced a steep fall and hit a low of $0.44. At the $0.50 high, the upward corrective is strongly rejected. If, then ENJ/USD will be forced to trade in a range.


