
Bitcoin and the other cryptocurrencies are have resumed consolidations above their respective support levels. The upward moves have been restrained by the 21-day line SMA. The price movement has been constrained by the appearance of Doji candlesticks . The candlesticks indicate that buyers and sellers have reached a period of indecision. Let us examine each of these coins.
BTC/USD Major Trend: Bearish
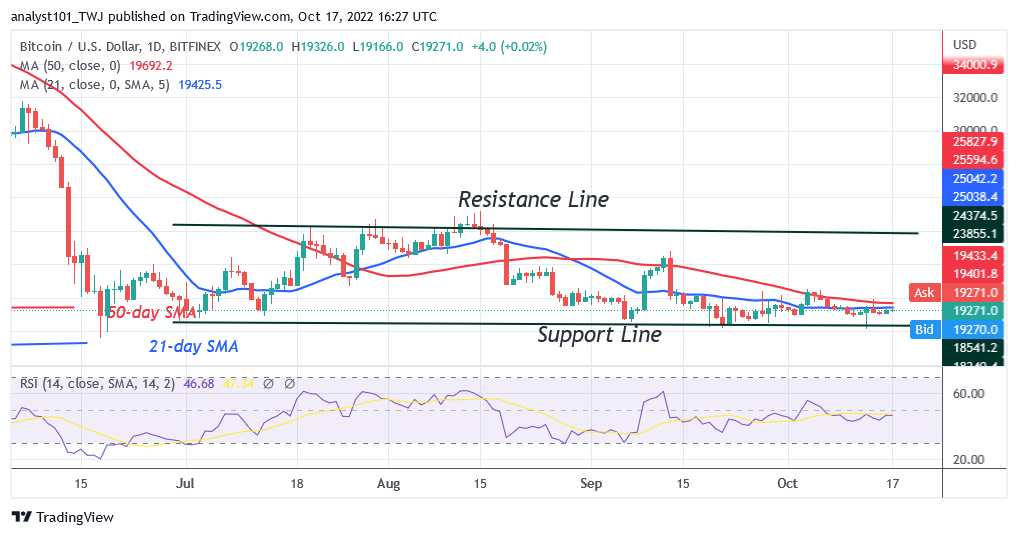
Bitcoin’s (BTC) price is in a downtrend but buyers are making concerted efforts to break above the moving average lines. Buyers are intending to break above the moving average lines and the resistance at $20,000 high. This will propel Bitcoin to resume uptrend and the BTC/USD is expected to revisit the overhead resistance at $2 5,205. On the upside, buyers have broken above the moving average lines twice on September 12 and October 4 but were repelled. Today, if buyers are successful, Bitcoin will revisit the previous highs.
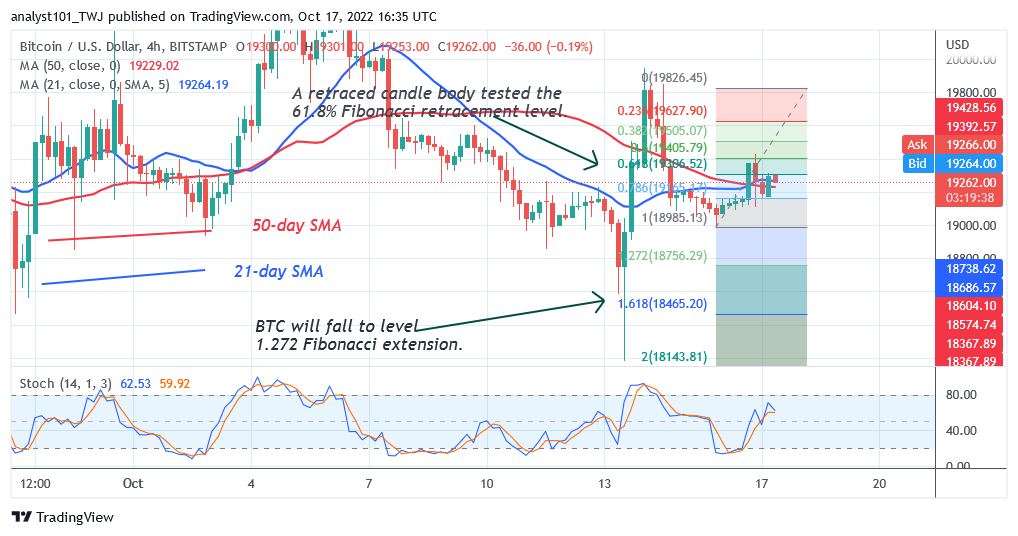
In the meantime, the largest cryptocurrency is above the 80% range of the daily Stochastic. The current uptrend is reaching the overbought region. Bitcoin may face rejection at the recent high. The current range bound move will continue if Bitcoin turns down from the moving average lines.
SAND/USD Major Trend: Bearish
The Sandbox (SAND) price has fallen significantly from the high of $8.49 to a low of $0.78. The decline was above the previous low of $0.70 support.
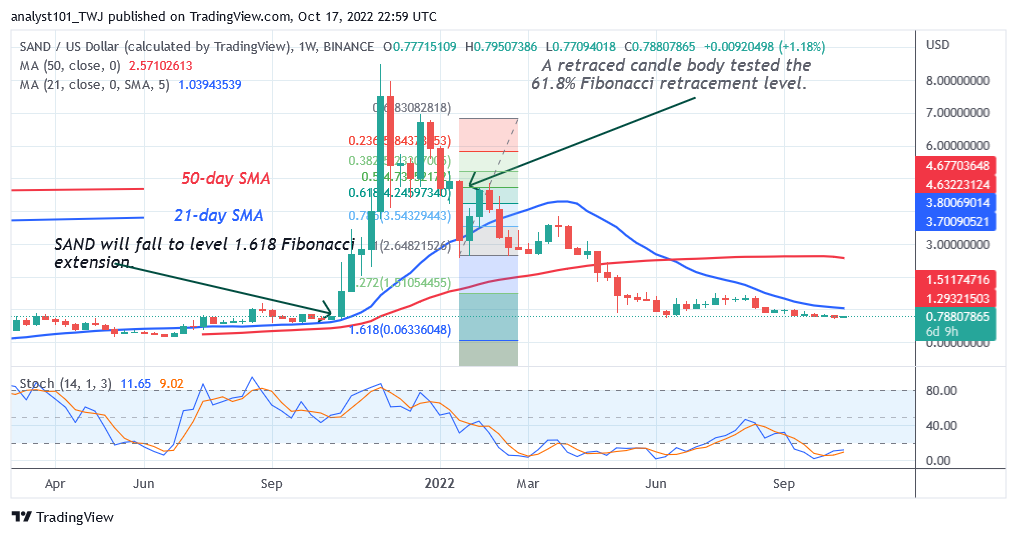
On a weekly chart, the altcoin has fallen st the bottom of the chart. On January 17 downtrend, the SAND corrected upward and a candle body tested the 61.8% Fibonacci retracement level. The correction implies that the SAND will fall to level 1.618 Fibonacci extension or $0.062. From the price action, the SAND has fallen to the low of $0.78. The altcoin has fallen to the oversold region of the market. The current downtrend is likely to subside.
MANA/USD Major Trend: Bearish
Decentraland (MANA) price is in a downtrend as the cryptocurrency trades below the moving average lines. Since the August 28 price slump, the upward moves by buyers have been restrained by the 21-day line SMA.
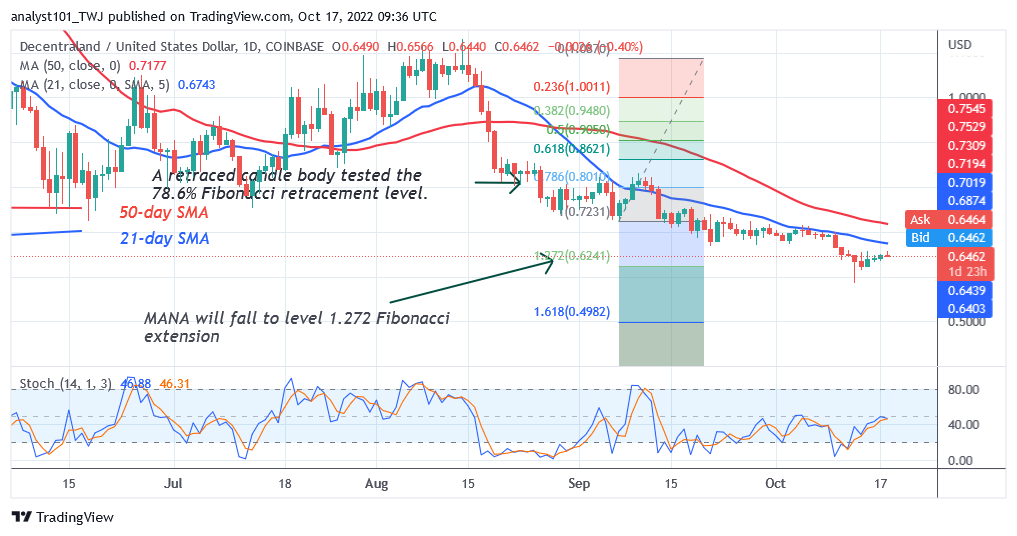
Today, MANA is trading at $0.64 at the time of writing. On October13, the coin dropped sharply to the low of $0.58 as bulls bought the dips. The $0.58 price level is the previous low of May 12. On September 6 downtrend, MANA made an upward correction, and a candle body tested the 78.6% Fibonacci retracement level. The correction implies that MANA will fall to level 1.272 Fibonacci extension or $0.62
APE /USD Major Trend: Bearish
ApeCoin’s (APE) price is in a downward correction as it declines to the low of $3.87 and resumes consolidation above the current support.
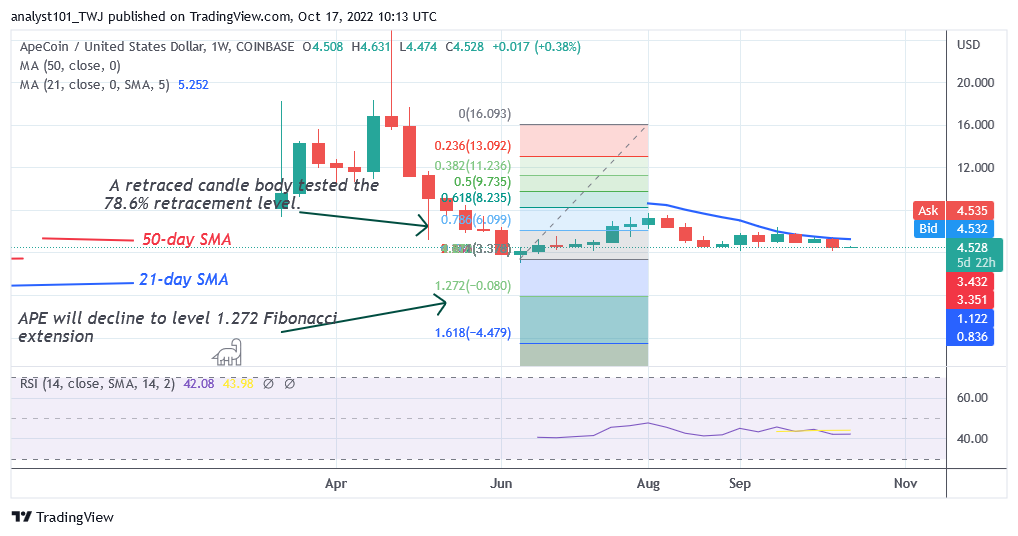
The cryptocurrency has fallen significantly and reached bearish extension. Presently, the upward moves have hindered at the 21-day line SMA. Meanwhile, on June 13 downtrend, APE made an upward correction, and a candle body tested the 78.6% Fibonacci retracement level. The correction implies that ApeCoin will fall but reverse at level 1.272 Fibonacci extension or $0.080.
ENJ /USD Major Trend: Bearish
Enjin Coin (ENJ) price is in a downtrend and have fallen at the bottom of the chart.
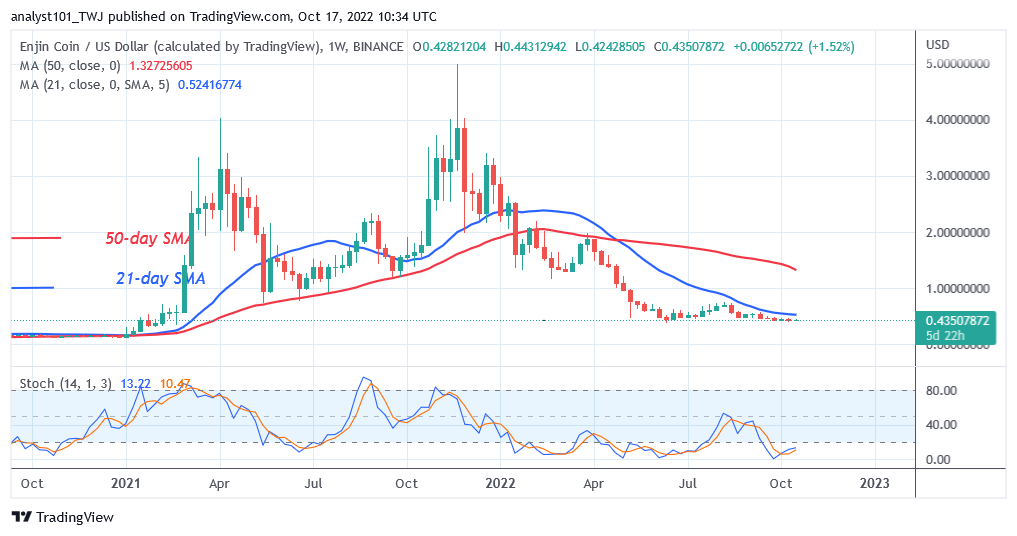
Since June 6, the altcoin declined to the low of $0.48 and resumed consolidation above the current support. The price action has been dominated by small body indecisive candlesticks call Doji. The candlesticks has caused the altcoin to trade marginally. The price movement has remained stagnant. Meanwhile, ENJ has reached the oversold region and below 20% range of the daily Stochastic. The selling pressure has reached bearish exhaustion.


