
Bitcoin and the other cryptos are compelled to a range-bound move as the upward moves are being restricted by the moving average lines. Bitcoin is in a tight range and confined between the moving average lines. Also, the price movement has been marginal because of the presence of small-body indecisive candlesticks.
BTC/USD Major Trend: Bearish
Bitcoin’s (BTC) price has resumed a sideways move. On October 4, buyers attempted to resume an uptrend above the moving average lines. The bullish move was repelled as sellers push back the BTC price.
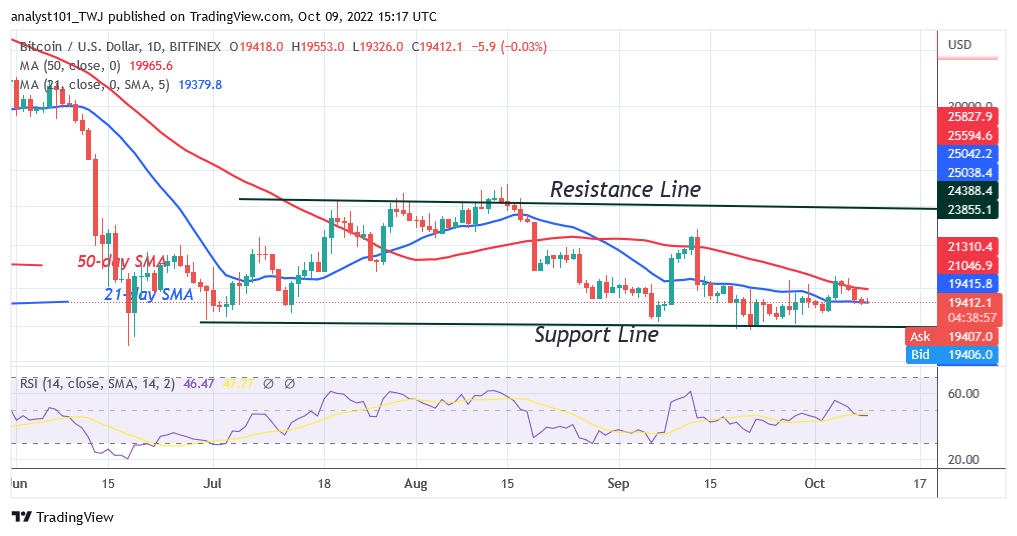
The largest cryptocurrency is stuck between the moving average lines. Further price movement will depend on breaking the moving average lines. Bitcoin will fluctuate between the moving average lines where the range-bound levels remain unbroken. On the downside, Bitcoin will revisit the $18,200 support when sellers breach the 21-day line SMA. The sideways move will continue if the 21-day line holds. On the 1-hour chart, Bitcoin is said to decline to the previous low but may reverse from the current downtrend.
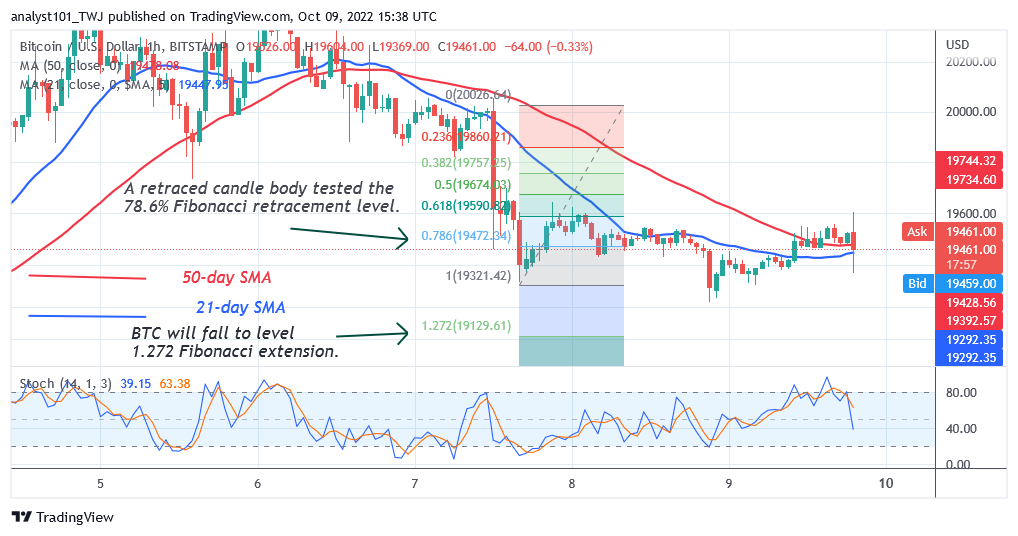
On October 7 price slump, Bitcoin corrected upward and the candle body tested the 78.6% Fibonacci retracement level. The correction suggests that it will fall but reverse at level 1.272 Fibonacci extension or $19,129.61 price level. Bitcoin is capable of falling as it is at level 46 of the Relative Strength Index for period 14.
SAND/USD Major Trend: Bearish
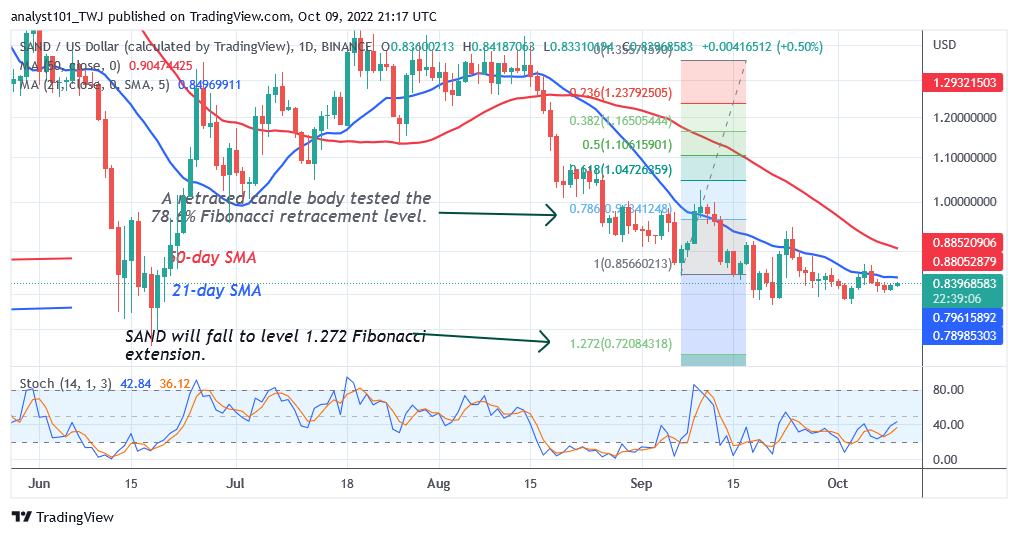
The Sandbox (SAND) price declined to the low of $0.80 on September 21. For the past two weeks, the cryptocurrency has been trading above the $0.80 support. Upward price movement has been restrained by the 21-day line SMA. Each time, the crypto’s price retests the 21-day line moving average; the SAND would decline above the current support. Meanwhile, the altcoin risks further decline if the current support is beached.
MANA/USD Major Trend: Bearish
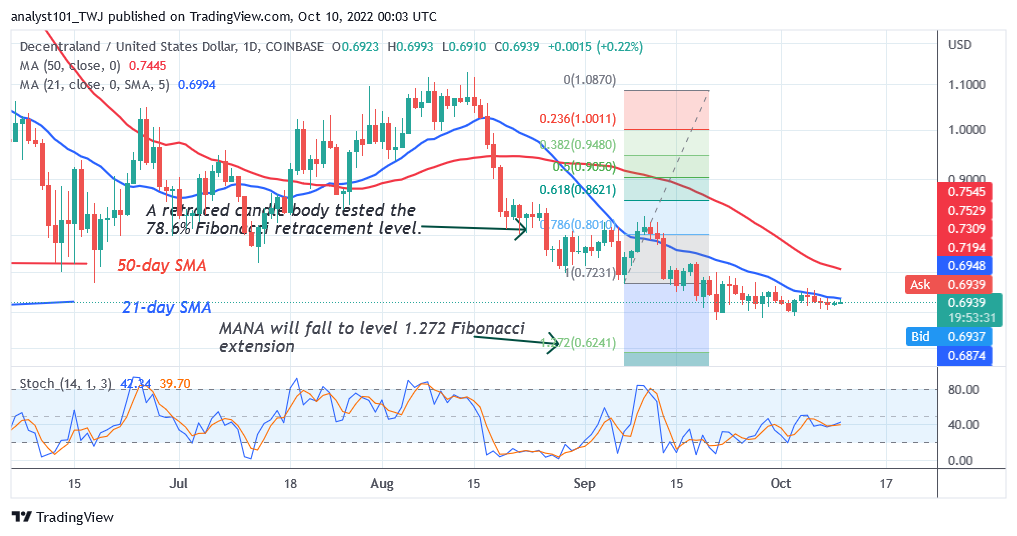
Decentraland (MANA) price is in a downtrend as it fell to the low of $0.66 on September 21. Since September 21, the price action has remained the same. The price action is dominated by small body indecisive candlesticks called Doji and Spinning Tops. The price movement has been stagnant above the current support. The upward movement of price has been restrained by the 21-day line SMA. The market will decline to $0.62 if the current support is breached.
APE /USD Major Trend: Bearish
ApeCoin’s (APE) price is in a downward correction as price breaks above the 50-day line SMA. The upward move is stuck below the 21-day line SMA. The crypto now fluctuates between the moving average lines.
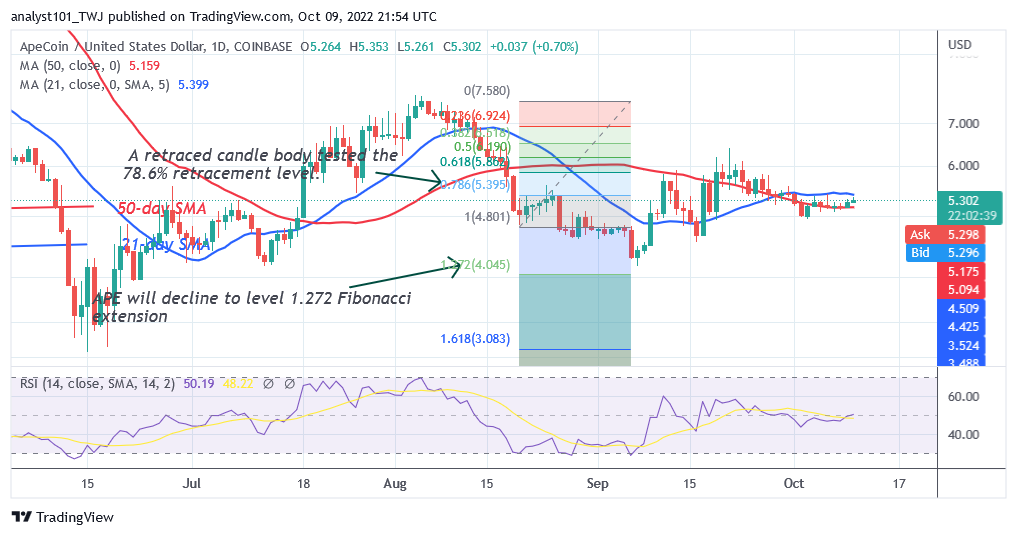
The coin will trend when the moving average lines are breached. For instance, if buyers breach the 21-day line SMA, the market will rally to the high of $7.00. Further upward movement of the coin is doubtful because of the presence of Doji candlesticks. Meanwhile, the market has reached the equilibrium price level as it is at level 49 of the Relative Strength Index for period 14. It implies that buyers will emerge in the oversold region to push prices upward.
ENJ /USD Major Trend: Bearish
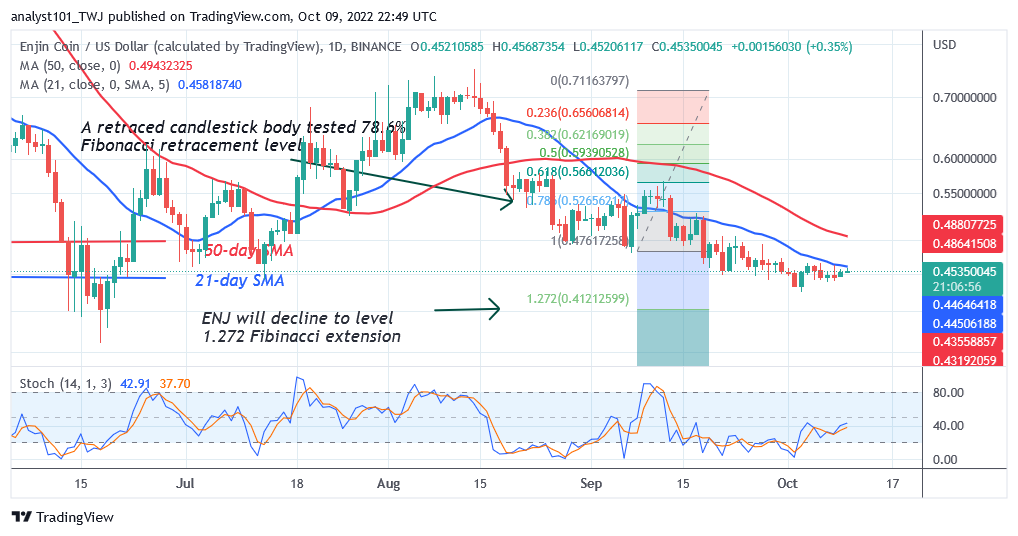
Enjin Coin (ENJ) price is in a downward correction and the selling pressure has continued unabated. On October 2, the altcoin declined to the low of $0.43 and resumed consolidation above the current support. The upward moves are restricted by the 21-day line SMA. ENJ/USD has fallen to the oversold region of the market. It is below the 20% range of the daily Stochastic.


