
Interestingly, Bitcoin’s (BTC) price rallied to an impressive high of $66,958. However, the cryptocurrency reached an overbought region of the market. Bitcoin declined and resumed upward correction above the $60,000 psychological price level. Similarly, the four altcoins have sustained recent rallies above the moving averages. The cryptos are trading to break above their respective previous highs.
BTC/USD Major Trend: Bullish
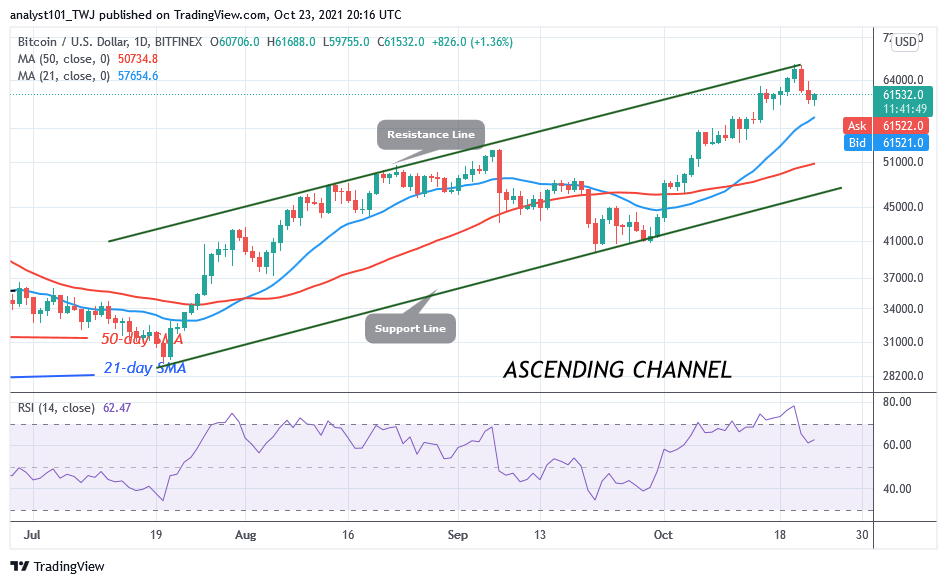
On October 23, Bitcoin declined and found support above $60,000. For the past two days, the BTC price has been consolidating above the current support. In the previous price action, Bitcoin rallied to the high of $66,958 but the bullish momentum could not be sustained above the recent high. BTC/USD has retraced from the high of $66,958 to the low of $59,755. The recent decline was a result of the overbought condition of the cryptocurrency. For instance, on October 20, the BTC price was at 96% range of the daily stochastic.
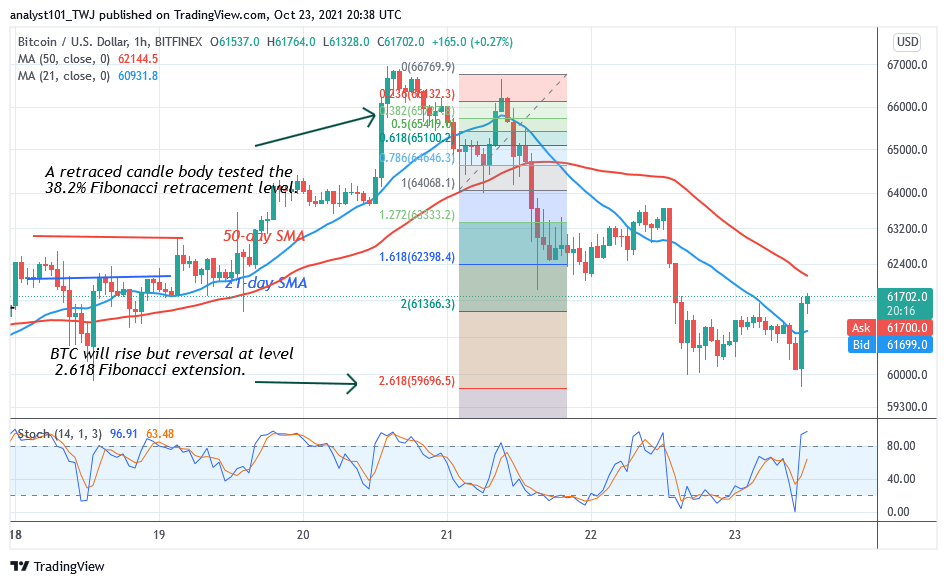
Similarly, it is at level 78 of the Relative Strength Index period 14. These price indicators have shown that Bitcoin has not enough room to rally on the upside. Sellers emerge at the overbought region to push prices down. Sellers have emerged as Bitcoin fell above $60,000 support. Buyers will have an uphill task to push Bitcoin above the moving averages. The current support is holding as Bitcoin resumes a new uptrend. The cryptocurrency will resume upside momentum if it reclaims the $64,000 support.
XRP/USD Major Trend: Bullish
Ripple’s (XRP) price is trading above the moving averages. In other words, XRP is trading above the $1.08 support. On October 20, the bulls could not sustain above the $1.16 resistance as the market declines to the support above $1.08.
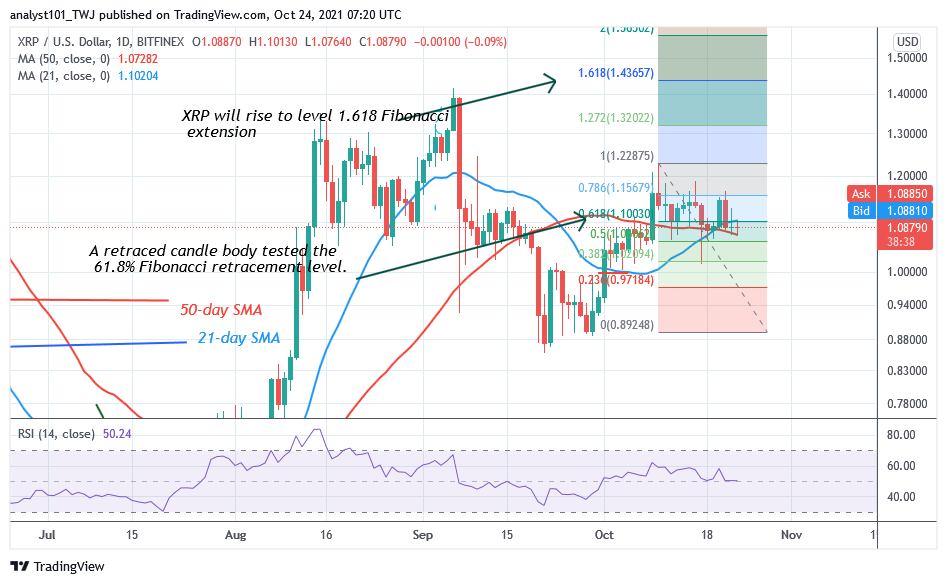
On the upside, if the price breaks the resistance at levels $1.16 and $1.20, XRP will rise to $1.40 high. Meanwhile, on October 9 uptrend; a retraced candle body tested the 61.8% Fibonacci retracement level. The retracement indicates that XRP price will rise to level 1.618 Fibonacci extension or level $1.43.
DOT/USD Major Trend: Bullish
Polkadot’s (DOT) price has been struggling to break above the resistance at $45. Since October 15, the bulls have failed to keep the price above the recent high. The cryptocurrency will rally to $50 high if the bulls breach the recent high. However, if the bulls fail to sustain the bullish momentum, the cryptocurrency will fall.
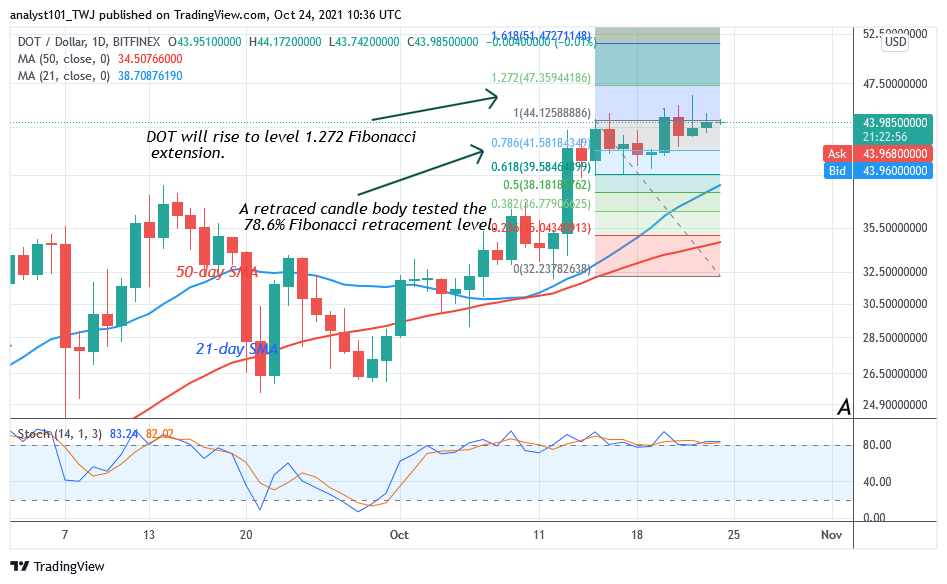
A decline to $34 is expected. Moreover, Polkadot has been trading in the overbought region since October 9. The upward move is doubtful and besides, sellers will emerge in the overbought region to push prices down. Meanwhile, on October 15 uptrend; a retraced candle body tested the 78.6% Fibonacci retracement level. The retracement indicates that DOT price will rise but reverse at level 1.272 Fibonacci extension or level $47.35.
LTC /USD Major Trend: Bullish
Litecoin’s (LTC) price has broken above the moving average to reach the high of $210. The cryptocurrency is facing a minor resistance at the recent high. The altcoin has fallen to $187 low and resumed consolidation above it. Litecoin has resumed a fresh uptrend to revisit the previous highs.
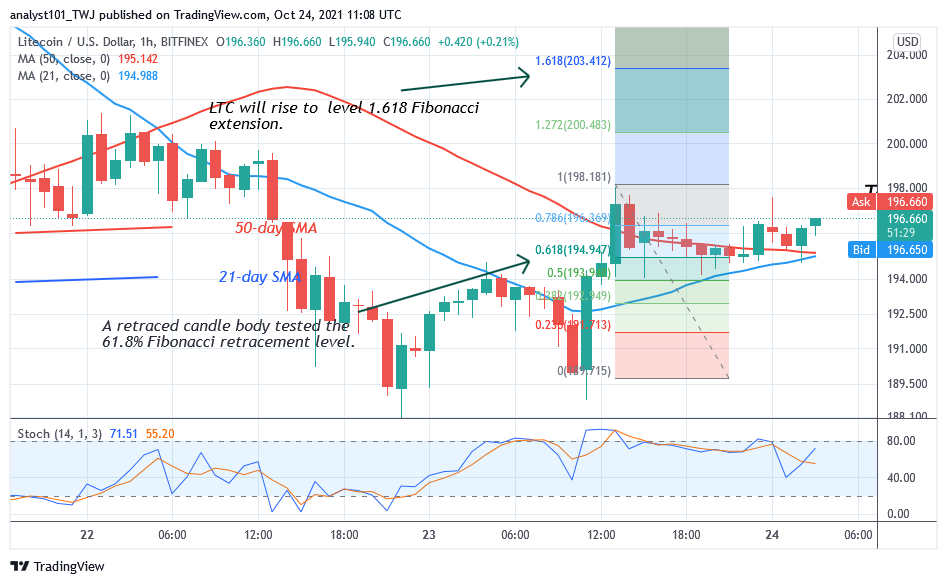
On the upside, a breakout at the resistance will propel the altcoin to $232 high. The bullish momentum will extend to the high of $240. On the other hand, if the bulls fail to break the overhead resistance, Litecoin will resume a range-bound move below the resistance. Meanwhile, on October 23 uptrend; a retraced candle body tested the 61.8% Fibonacci retracement level. The retracement indicates that Litecoin is likely to rise to level 1.618 Fibonacci extension or level $203.41.
LINK /USD Major Trend: Bullish
Today, Chainlink’s (LINK) price has rallied to the high of $31.50 but faces rejection. The resistance is the historical price level of September 17. Since September 17, the resistance at $31.50 has remained unbroken. However, the bullish momentum is likely to extend to the previous peak price if the current resistance is breached. From the Fibonacci tool analysis, the market will retrace and resume a fresh uptrend.
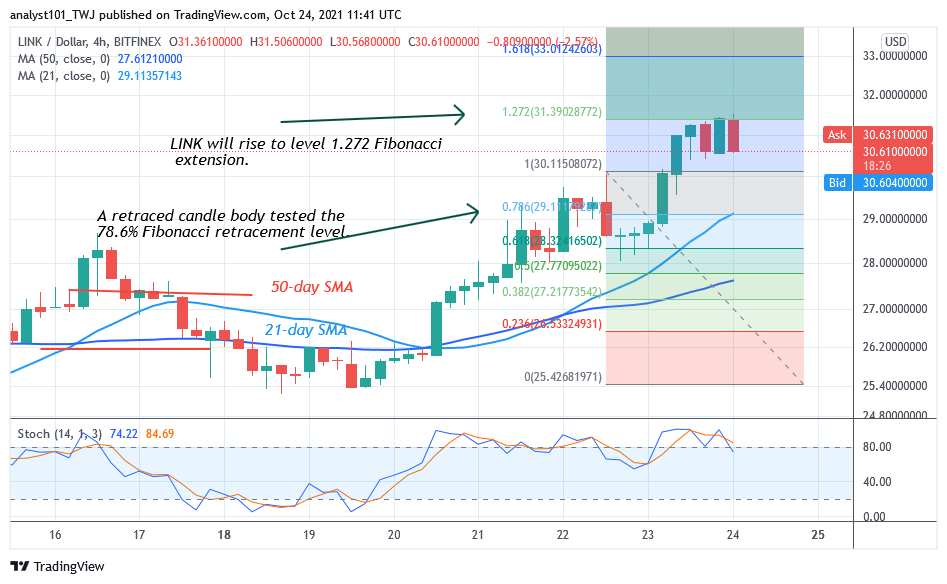
Meanwhile, on October 22 uptrend; a retraced candle body tested the 78.6% Fibonacci retracement level. The retracement indicates that LINK is likely to rise but reverse at level 1.272 Fibonacci extension or level $31.39. Chainlink will reverse but return to the 78.6% Fibonacci retracement level where it originated. From the price action, Chainlink will reverse to level $29 or above the 21-day SMA.