Cryptos Price Analysis of August 15: BTC, ETH, XRP, and BCH
The king coin and the three altcoins are trading in the bull markets. On August 11, the four coins have breakdowns but today the cryptos have recovered. This has been the market situation as the cryptos are correlated in the crypto currency market.
BTC/USD Major Trend: Bullish
Today, Bitcoin bulls retested the $12,000 overhead resistance for the third time. In all the attempts at the resistance, buyers fail to break the resistance level. Each time BTC is repelled, the market will fall to $11,100 and $11,250. In today’s resistance, BTC is hovering above $11,800 high for a possible breakout. On the upside, BTC can scale above the current resistance, if bulls clear the resistance between $11,950 and $12,050.

Bitcoin price movement will be accelerated above $12,000 if the bulls are successful. The king coin will reach its first target price at $13,000. Nevertheless, according to the Fibonacci tool, Bitcoin will reach a high of $15,000 if the bulls breached the $12,000 overhead resistance. In the August 2 uptrend, the bulls retested the $12,000 resistance, and a red candle body tested the 0.236 or 23.6% Fibonacci retracement level. This gives the impression that the market will rise and reach a high of 4.236 Fibonacci extension level or $15,000 high.
ETH/USD Major Trend: Bullish
Recently, On August 13, Ethereum rebounded above $390 as it broke the $400 overhead resistance. Today, Ether has reached a high of $440 but the coin has reached the overbought region. Sellers emerged at the overbought region to push prices down. After the retracement, Ether will resume the uptrend. On the upside, if price breaks the current resistance at $440, ETH will rise and achieve a target price of $480.
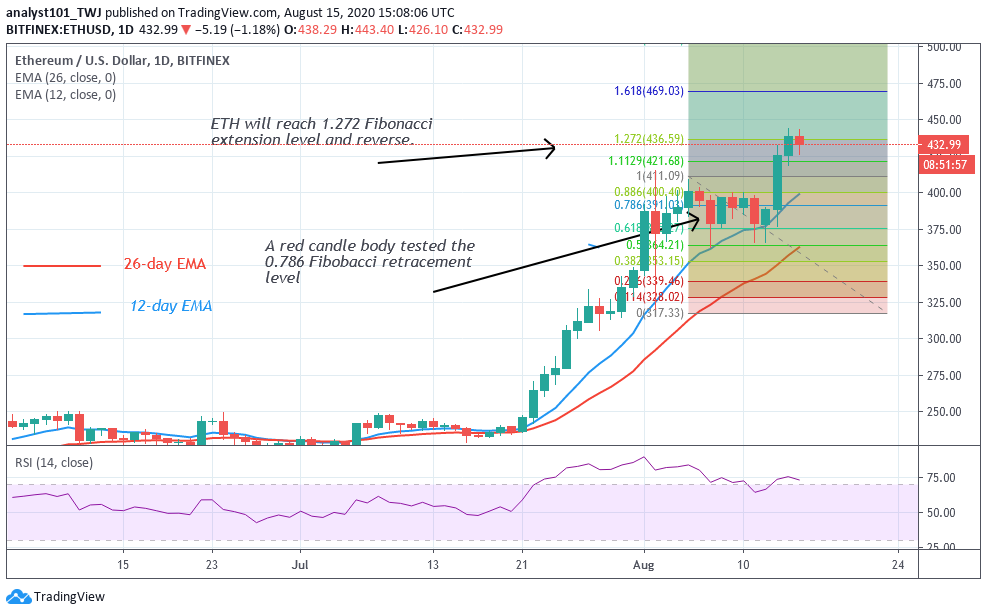
On August 5 uptrend, the bulls retested the $400 overhead resistance and were repelled. The retraced candle body tested the 0.786 or 78.6% retracement level. This indicates that price will reach a high of 1.272 Fibonacci extension level or $440 high. However, ETH will reverse from the 1.272 extension level to 0.786 retracement level where price originated. The retracement is being expected.
XRP /USD Major Trend: Bullish
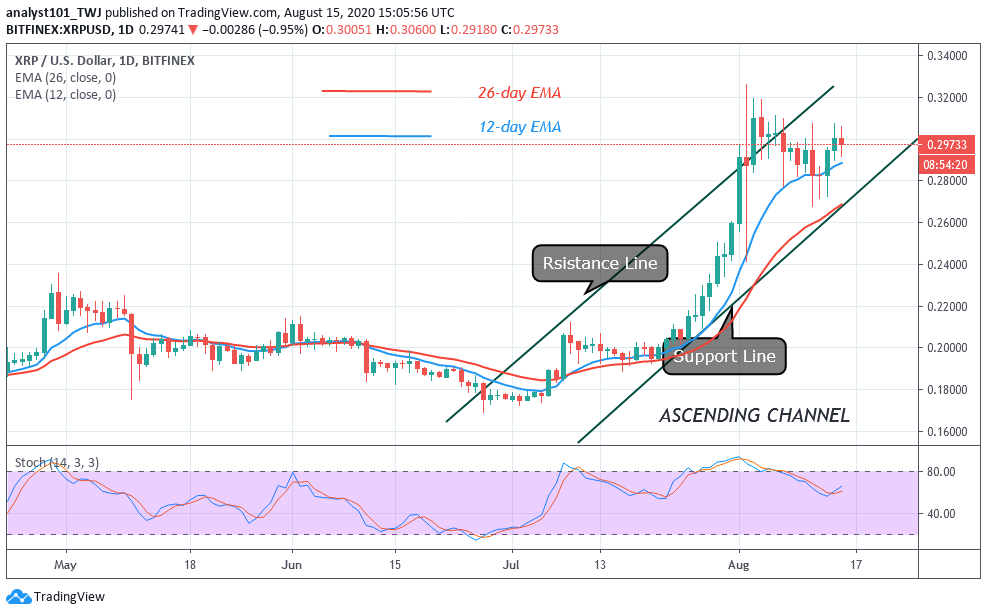
On August 13, Ripple rebounded above $0.28 support level as the market reached a high of $0.30. XRP has fallen again as the market faces rejection at the recent high. Ripple is trading at $0.29 at the time of writing. For the past two weeks, the crypto has been on a series of decline. In the last breakdown on August 11, the coin fell and found support above the 12-day EMA. As long as price is above the EMA, the coin will continue to rise. On the upside, a break above the $0.30 resistance will propel price to rally above $0.32 resistance. The momentum will continue to $0.36 high. Ripple is above 60% range of the daily stochastic. It indicates that the coin is in the bullish momentum.
BCH /USD Major Trend: Bullish
Since on August 13, buyers have been making frantic efforts to break above the $300 minor resistance. The coin has earlier rebounded but failed to break the current resistance. Today, BCH is trading at $293 below the resistance. BCH has the chance of rising to the previous high.
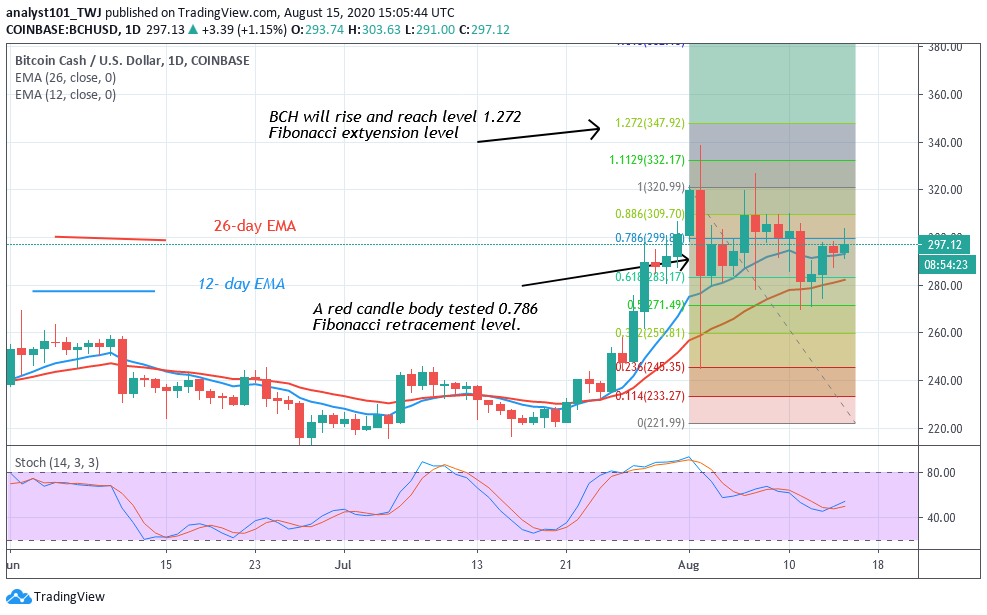
A strong bounce above $290 will break the $300 resistance and retest the $320 resistance. Nonetheless, if price breaks the $320 resistance, BCH will rise and reach the $350 high. According to the Fibonacci tool, BCH will rise. On the August 1 uptrend, the retraced candle body tested the 0.786 Fibonacci retracement level. This gives us the clue that price will rise and reached the 1.272 Fibonacci extension level or $350 high. At the 1.272 extension level, the market will reverse. It will reverse and return to 0.786 retracement level or $300.


